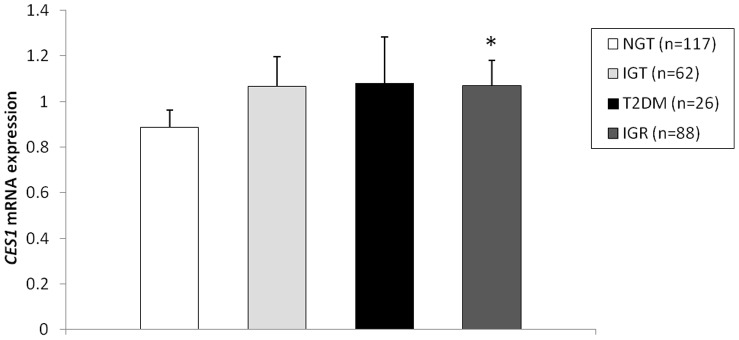
Figure 2. CES1 mRNA expression level in adipose tissue in individuals with normal glucose tolerance (NGT), impaired glucose tolerance (IGT), type 2 diabetes mellitus (T2DM), and impaired glucose regulation (IGR = IGT+T2DM). CES1: carboxylesterase 1 gene.

*P<0.05 compared to NGT after adjustment for age, gender, and body-mass index.
