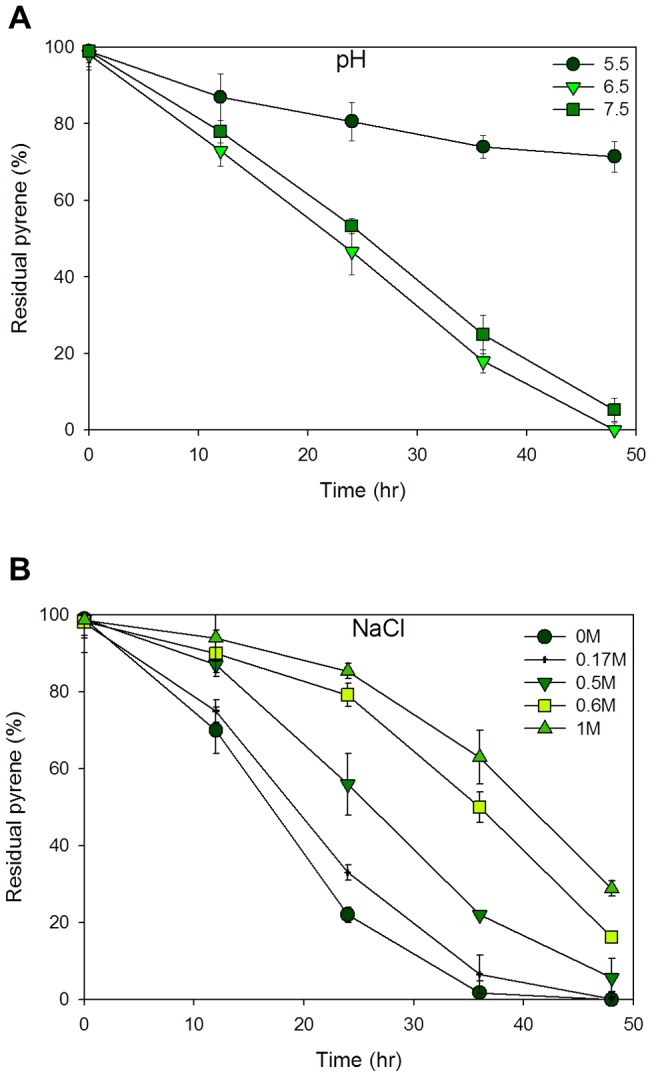
Figure 1. Pyrene degradation profiles showing the residual pyrene (%) in the various cultures.

Graph of culture induced with pH states of 5.5, 6.5 and 7.5 (A) and NaCl concentrations of 0 M, 0.17 M, 0.5, 0.6 and 1 M (B). pH states correspond to acidic nature of the oceans and polluted terrestrial environments while the NaCl concentrations correspond to the saline nature of the ocean and some industrial waste effluents. Data and standard error are means from two replicates.
