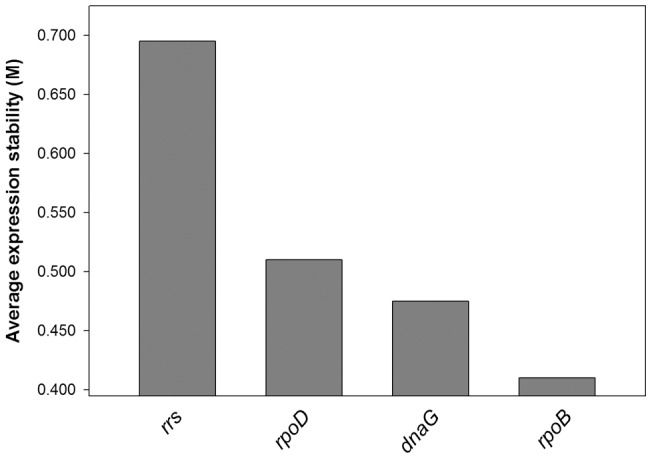
Figure 2. A chart indicating the value M of candidate reference genes.

The M value refers to the average expression stability of reference genes during a stepwise exclusion of the least stable expressed reference gene. Starting from the least stable gene at the left, the genes are ranked according to increasing expression stability, ending with the two most stable genes on the right (dnaG and rpoB).
