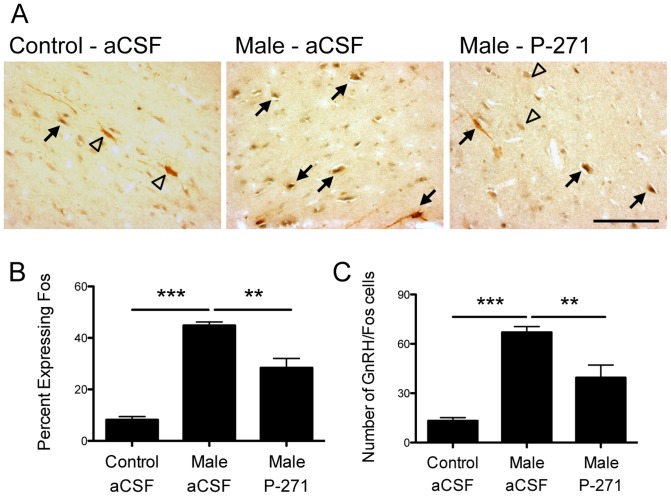
Figure 4. Male exposure in anestrous ewes resulted in Fos induction in GnRH neurons.
A, Bright-field photomicrographs indicate GnRH (brown) and Fos (black) neurons (arrows) in the mPOA. Single labled GnRH neurons are indicated by open triangles. Scale bar, 100 µm. B–C, The percentage of GnRH neurons co-expressing Fos and the number of GnRH/Fos neurons was greater in male exposed ewes compared to ewes not exposed to males (Control – aCSF). Kisspeptin antagonist treatment (P-271) reduced the percentage and number of GnRH cells co-expressing Fos in male exposed ewes. Data are the mean ± SEM, ***P<0.001, **P<0.01, n = 4 per group.

