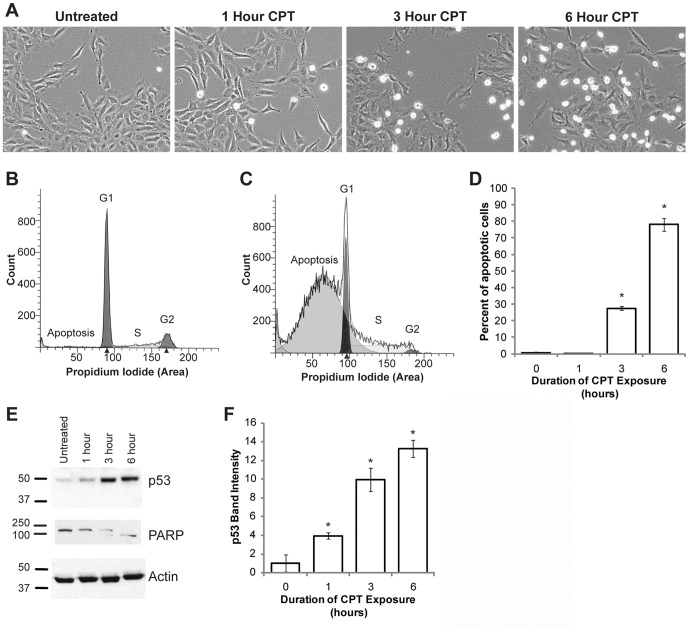
Figure 1. CPT induces apoptosis in H4-APP neuroglioma cells.
(A) H4-APP cells were exposed to 10 µM CPT for zero to six hours and examined using brightfield microscopy. Morphological changes indicative of apoptosis, including cell detachment and shrinkage, were noted after three hours of treatment and were most pronounced at six hours. (B) ModFit LT modeling of flow cytometry data obtained from untreated H4-APP cells stained with propidium iodide. In untreated cells, no sub-G1 population is observed. (C) Flow cytometric analysis of cells treated with 10 µM CPT for six hours and stained with propidium iodide showed a significant increase in sub-G1 cells, indicative of apoptosis. (D) Histogram of flow cytometry data from all time points across two independent experiments. A significant increase in apoptotic cells was identified at three and six hours in cells treated with CPT. Asterisks indicate significant difference from all other groups, p<0.001. (E) Representative blot from three independent experiments performed to determine the levels of p53 and PARP. CPT-induced apoptosis was associated with a time-dependent induction in p53 (E, top panel) and cleavage of PARP (E, middle panel). Reprobe of p53 blot with an antibody against β-actin showed equal protein loading (E, bottom panel). (F) Quantification of p53 blot showed a significant induction after one hour, p<0.001. Post hoc analysis revealed that each group is significantly different from all other groups.

