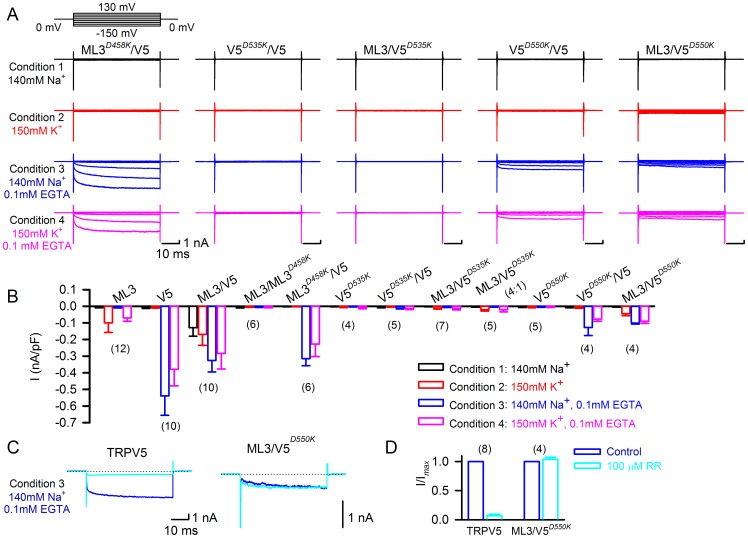
Figure 5. Effects of dominant-negative and inactive isoforms of TRPML3 and TRPV5.
(A) Representative whole cell currents shown were obtained from cells coexpressing TRPML3D458K and TRPV5 (ML3D458K/ V5), TRPV5D535K and TRPV5 (V5D535K/ V5), TRPML3 and TRPV5D535K (ML3/V5D535K), TRPV5D550K and TRPV5 (V5D550K/ V5), and TRPML3 and TRPV5D550K (ML3/V5D550K) under the four conditions indicated. Currents were recorded during voltage steps from −150 mV to +130 mV in 20 mV increments, holding at 0 mV. (B) Average inward current densities at −150 mV of the various TRPML3 and TRPV5 channel pairs under the four different conditions as indicated. Bar diagrams represent mean±SD, numbers in parentheses are the number of cells analyzed. (C) Pharmacological properties of HEK293 cells expressing TRPV5 and TRPML3/TRPV5D550K (ML3/V5D550K). Representative traces were recorded during voltage steps from 0 mV to −150 mV under condition 3 before (blue) and after (cyan) application of 100 µM ruthenium red (RR). (D) Quantitative analysis of the percentage of inhibition at −150 mV (mean±SD, n = parenthesized).

