
Figure 2. Area summation functions.
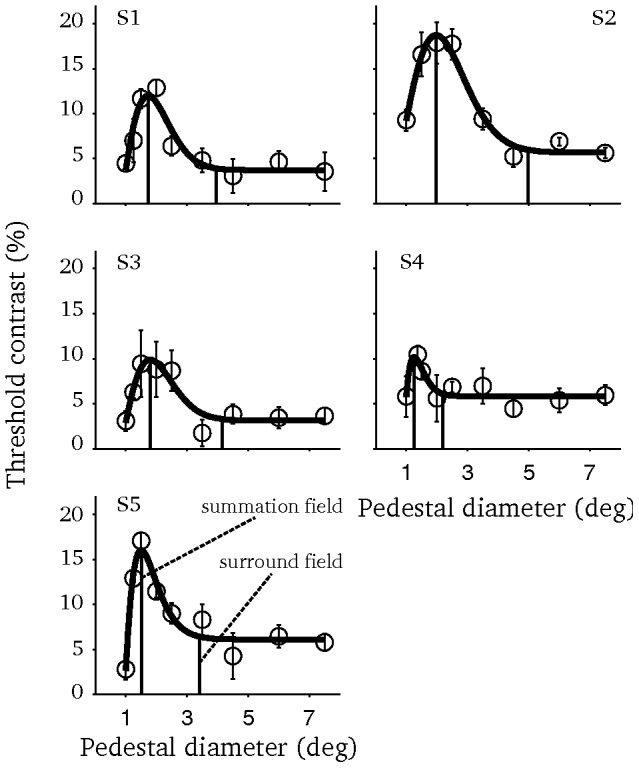
Each panel depicts the data of one subject. Smooth lines represent the fitted difference-of-integrals of Gaussians function. Vertical dashed lines mark the summation and surround field sizes. Errorbars depict the s.e.m.