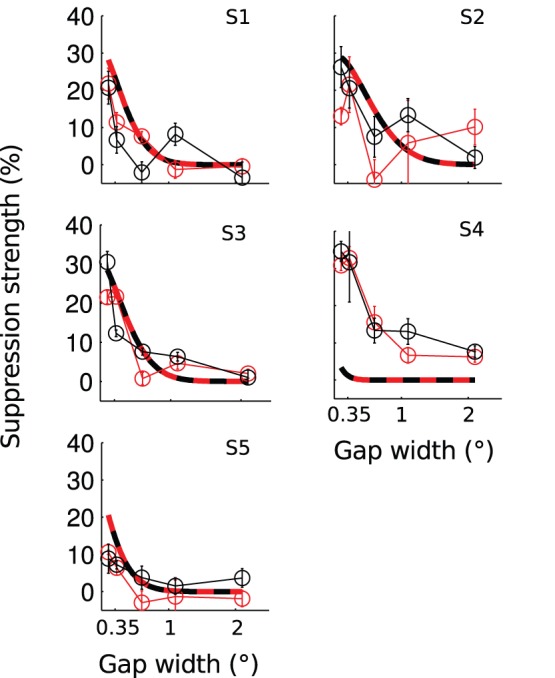
Figure 3. Surround suppression of perceived contrast as a function of the gap size.

The different panels present data of different subjects. Connected data points mark the measured mean ± s.e.m. Smooth curves present the modeled suppression. Model parameters were fixed based on the area summation experiment for each subject separately. Red marks the inward surround condition and black the outward.
