
Figure 4. V1 BOLD signal reduction as a function of the gap size.
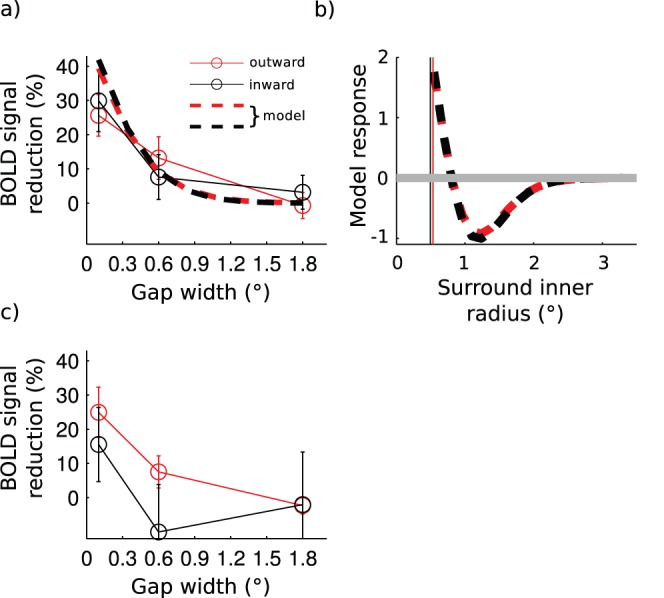
a) Results of the voxel-of-interest analysis. Connected data points mark the mean ± s.e.m. averaged over seven subjects. Dashed lines present suppression strength in the modeled neuronal population in which all parameters were fixed based on the area summation experiment. b) Modeled responses in the voxel-of-interest for surround stimulus displayed without the center. The gray horizontal line marks the baseline response c) Results of the region-of-interest analysis.