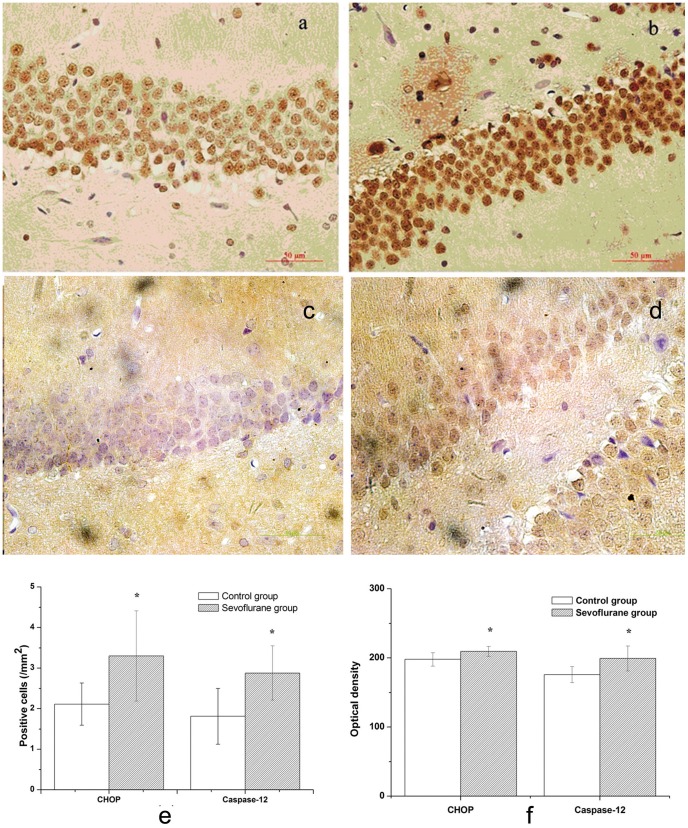
Figure 3. Immunohistochemistry of CHOP and Caspase-12 in hippocampus.
(a) CHOP immunostain in control group ×400. (b) CHOP immunostain in sevoflurane group ×400. (c) Caspase-12 immunostain in control group ×400. (d) Caspase-12 immunostain in sevoflurane group ×400. (e) Numbers of CHOP and Caspase-12-positive cells. (f) Optical density of CHOP and Caspase-12-positive cells. Data are presented as mean ± SD. *P<0.05, vs the control group.

