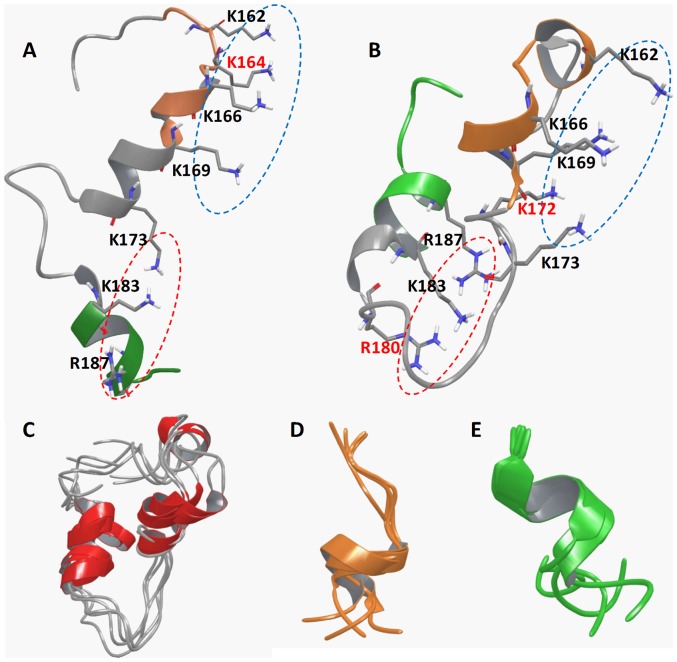
Figure 2. Structural representation of C-terminal peptides in cartons.
(A) The NMR structure of mouse Mesd C-terminal domain (155–191) based on the study of Chen et al. (24). (B) The most representative snapshot of the peptide mMesd (155–191). The segments of 160–169 and 183–191 were highlighted in orange and green colors. Residues that form the positive surface were shown in solid sticks. The two surface regions that consist of residues from 160–169 segment or from 183–191segment were marked with blue and red dashed circles. Residues that are unique in the positive surface of A) or B) were labeled with red-color. (C–E) The most populated conformations based on clustering analysis of the simulation snapshots of three C-terminal peptides mMesd (155–191) (C), mMesd (160–169) (D) and mMesd (183–191) (E).

