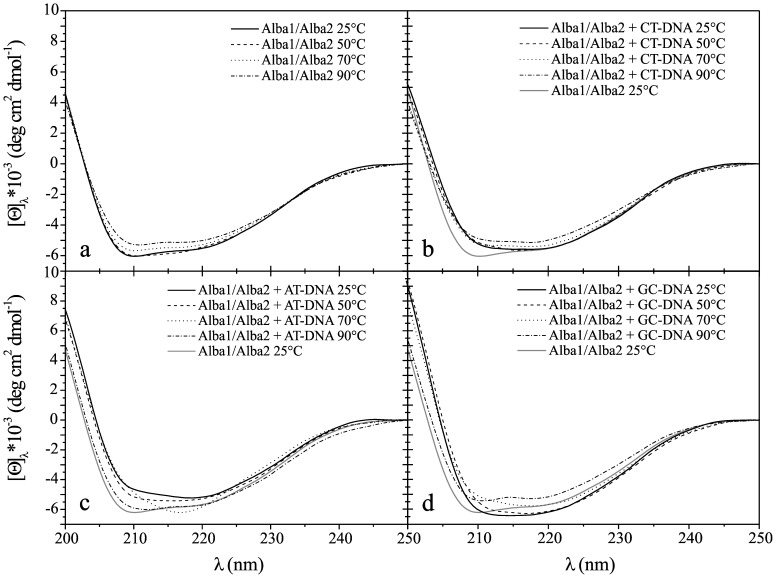
Figure 9. CD spectra of Alba1/Alba2 complex.
Molar ellipticity, [Θ], in the far-UV range (200–250 nm) at different temperatures (as indicated), for the Alba1/Alba2 complex without bound DNA (a), with CT-DNA (b), with AT-DNA (c), and with GC-DNA (d). Molar ratio of Alba:DNA per base pair was 1∶5 at pH 7.0 (50 mM NaH2PO4).

