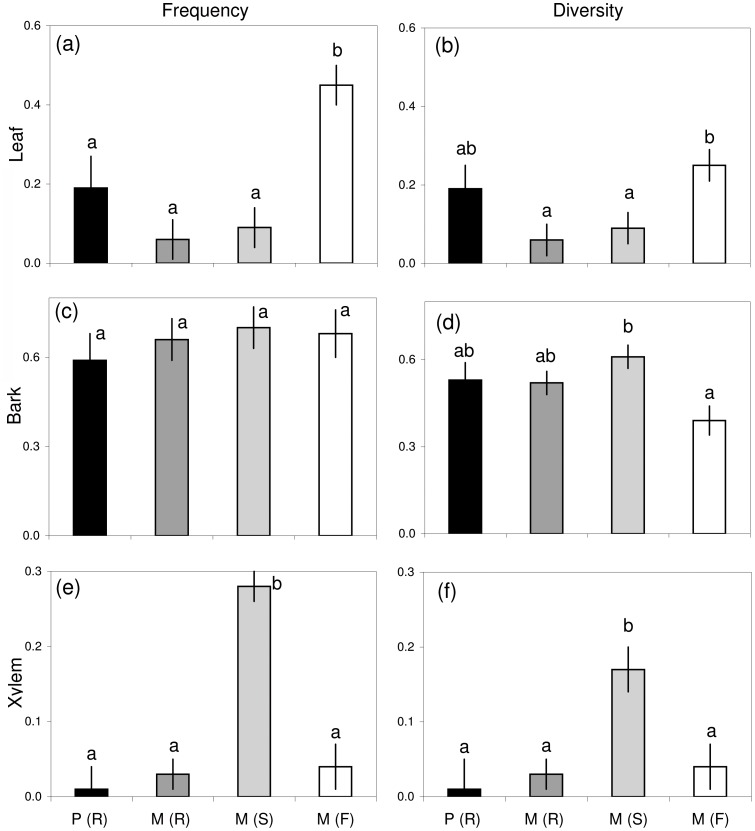
Figure 3. Endophyte frequency and diversity in elms.
Mean values of endophyte frequency (a, c, e) and endophyte diversity (b, d, f) of leaf (a, b), bark (c, d), and xylem (e, f) tissues from different groups of elm trees: P (R) = resistant U. pumila clones from Puerta de Hierro Forest Breeding Centre; M (R) = resistant U. minor clones from Puerta de Hierro Forest Breeding Centre; M (S) = susceptible U. minor clones from Puerta de Hierro Forest Breeding Centre; and M (F) = U. minor trees from Rivas-Vaciamadrid field site. Different letters indicate differences among groups of trees (P<0.05), and bars represent standard errors.

