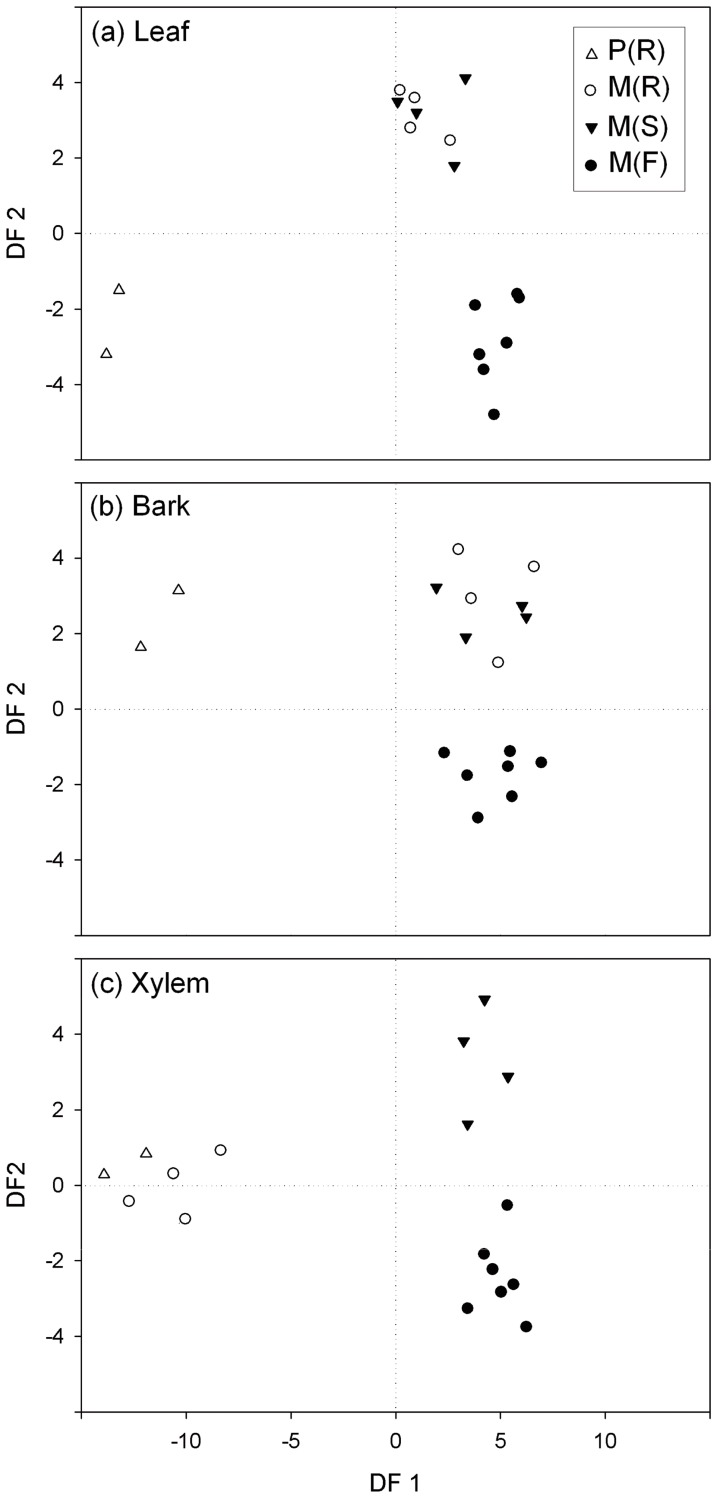
Figure 6. Separation of elm trees on basis of tissue specific phenolic profiles.
Discriminant function analysis score scatter plot for the HPLC chromatogram peaks of samples taken from leaf (a), bark (b), and xylem (c) tissues from different groups of trees: P (R) = resistant U. pumila clones from Puerta de Hierro Forest Breeding Centre; M (R) = resistant U. minor clones from Puerta de Hierro Forest Breeding Centre; M (S) = susceptible U. minor clones from Puerta de Hierro Forest Breeding Centre; and M (F) = U. minor trees from the Rivas-Vaciamadrid site.

