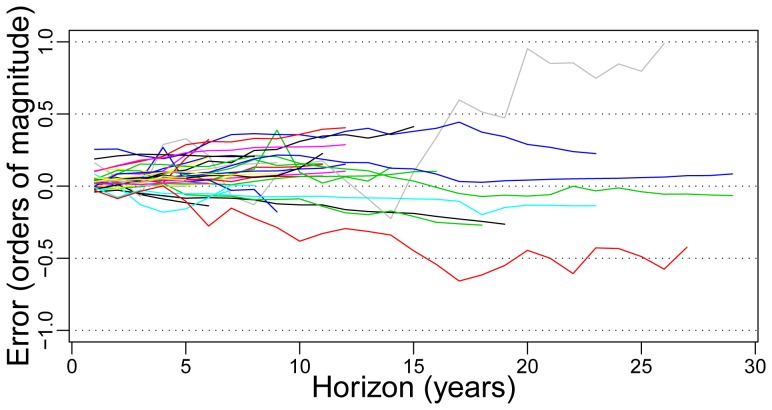
Figure 1. An illustration of the growth of errors with time using the Wright model.
The mean value of the logarithmic hindcasting error for each dataset is plotted against the hindcasting horizon  , in years. An error of
  , for example, indicates that the predicted value is three times as big as the actual value. The longest data-sets are: PrimaryAluminum (green), PrimaryMagnesium (dark blue), DRAM (grey), and Transistor (red).

