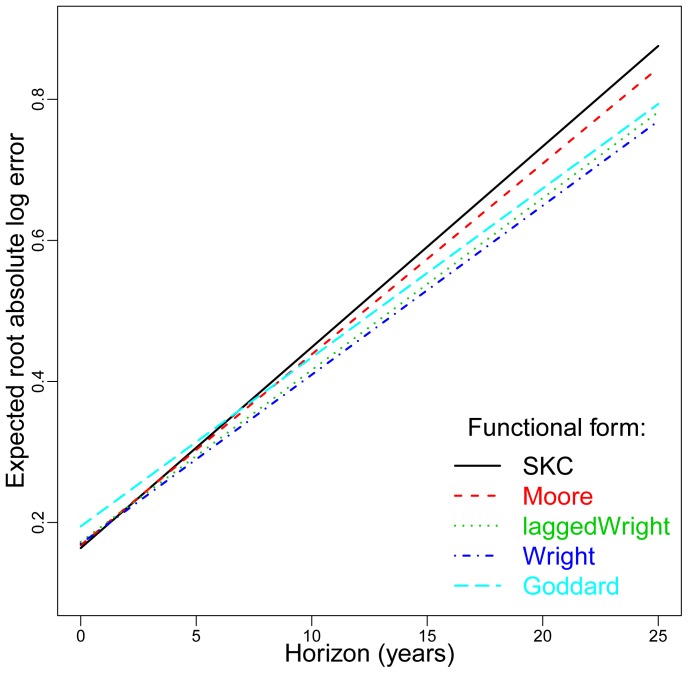
Figure 2. An illustration of the growth of errors of each hypothesized law vs. time.
The plot shows the predicted root absolute log error  vs. forecasting horizon
  using each of the functional forms (see Eq. (6)). The performance of the five hypotheses shown is fairly similar, though Goddard is worse at short horizons and SKC and Moore are worse at long horizons.

