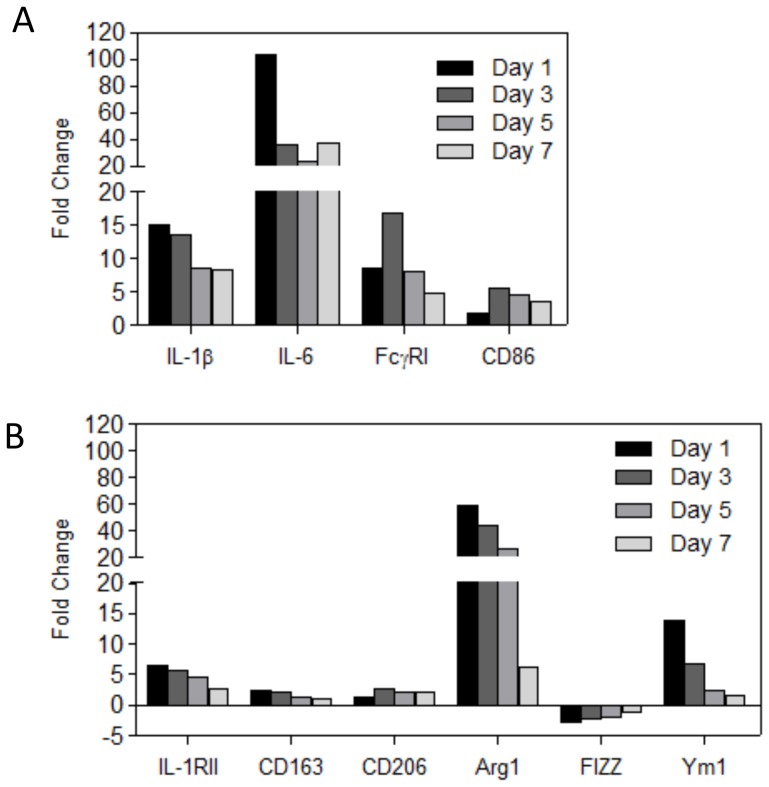
Figure 1. Expression of M1 and M2 markers within the inflamed synovium during AIA as determined by micro-array analysis.
Gene expression was determined at day 1, 3,5 and 7 after induction of AIA. Fold increase of gene expression was compared to synovium of naïve mice. A: Expression of M1 markers (IL-1β, IL-6, FcγRI and CD86). B: Expression of M2 markers (IL-1RII, CD163, CD206, Arg1, FIZZ1 and Ym1). Note that expression of M1 markers is highly upregulated compared to M2 markers, with the exception of Arg1 and Ym1. Values are presented as the fold change in mean gene expression levels (relative to GAPDH) from mean gene expression levels of inflamed synovium (n = 8) compared to synovium drived from naïve mice (n = 3).

