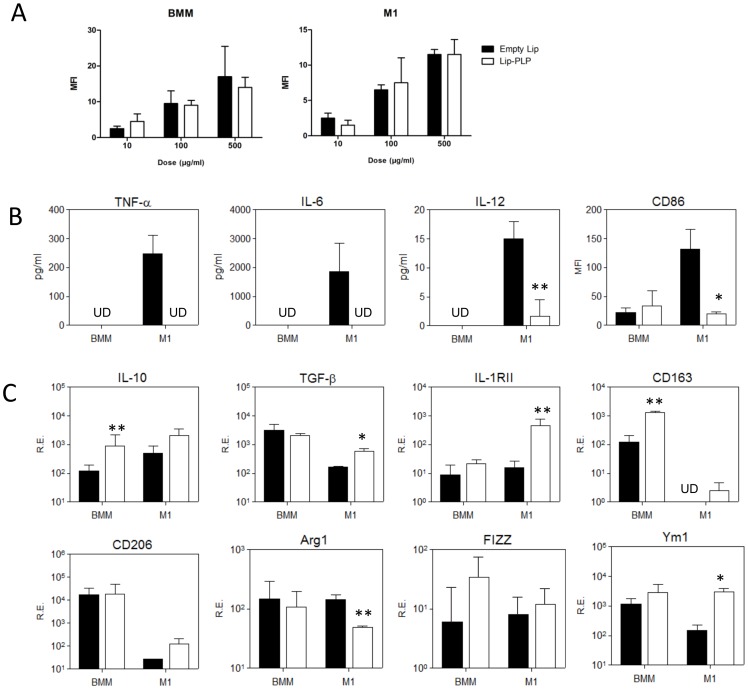
Figure 3. Effect of Lip-PLP on M1 macrophages in vitro.
Cells and supernatant of bone-marrow macrophages (BMM) and M1 macrophages (stimulated with LPS and IFN-γ for 24 hours) were obtained 24 hours after treatment with Lip-PLP or saline. A: Uptake of fluorescent liposomes by BMM and M1 macrophages as measured by flow cytometry. Note that uptake of liposomes is dependent on the amount of liposomes but not on PLP content. B: Protein levels of M1 cytokines TNF-α, IL-6 and IL-12 within the supernatant and surface expression of M1 marker CD86 as determined by flow cytometry. C: Gene expression of M2 markers. RE = Relative Expression compared to values of GAPDH. Data are expressed as mean +/− S.D. UD = undetectable. Three independent experiments were performed. Statistical significance was determined by Student's t-test. * = P<0.05, ** = P<0.01 compared to saline treatment.

