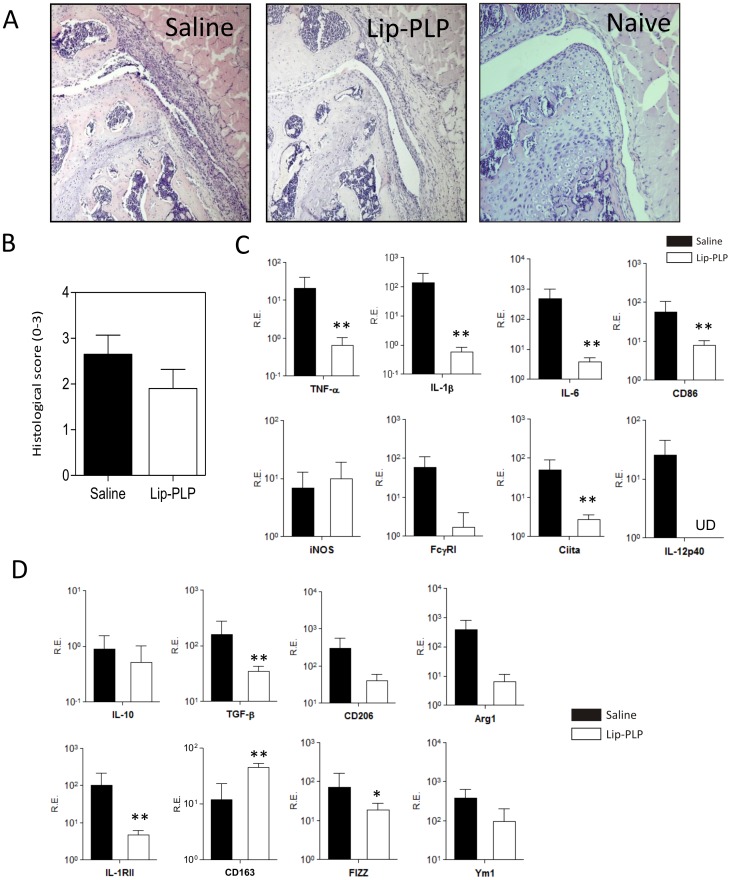
Figure 6. Effect of Lip-PLP on M1 and M2 marker expression within the synovium during ICA.
A: Photomicrographs of frontal knee joint sections of mice with ICA at day 1 after treatment. B: Histological scoring of synovial infiltration mice with ICA at day 1 after treatment with saline or Lip-PLP. C+D: Expression of M1 (C) and M2 (D) markers in the synovium during ICA. RE = Relative Expression compared to values of GAPDH. Mice were treated at day 1 after induction of ICA and biopsies were obtained at day 1 after treatment. Data are expressed as mean +/− SD of eight animals. UD = undetectable. Statistical significance was determined by Student's t-test. * = P<0.05, ** = P<0.01 compared to saline treatment.

