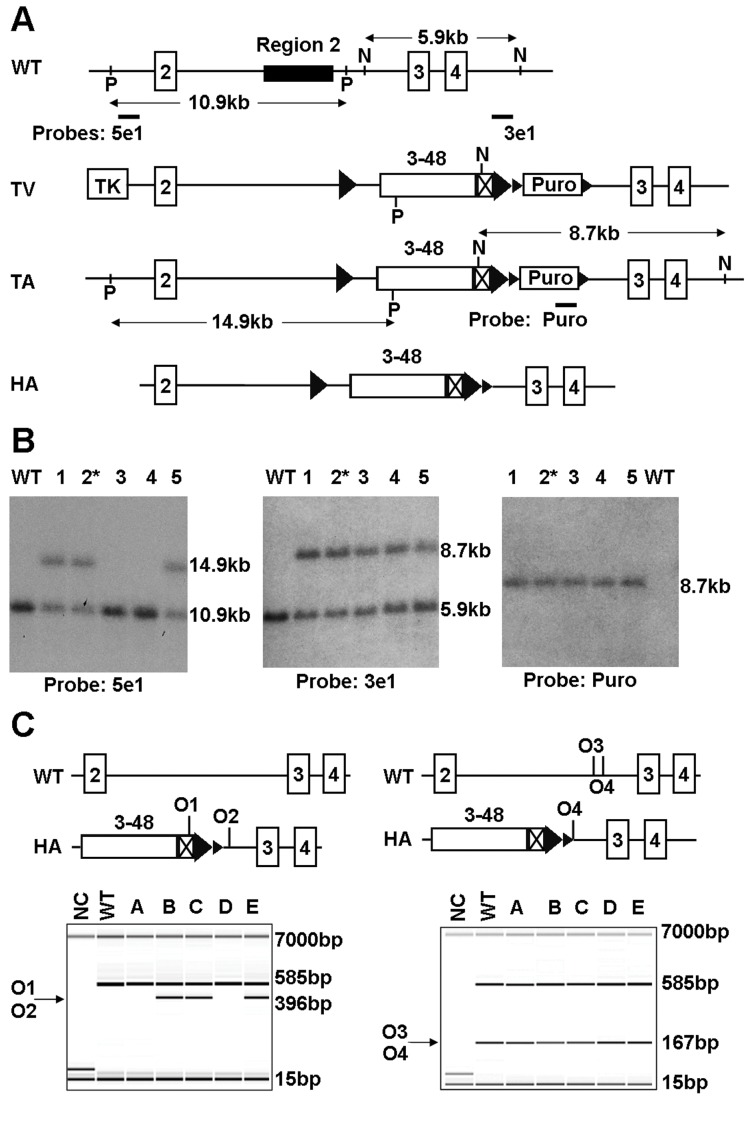
Figure 1. Transgene targeting and genotyping.
(A) Schematic diagram of Igf2r humanisation targeting strategy. Exons are represented as numbered boxes, loxP sites as small triangles, FRT sites as large triangles, human IGF2R mini-gene (Exons 3–48) as open box, mouse 3′ UTR as crossed box. WT, wild type; TV, targeting vector; TA, targeted allele; HA, humanised allele; P, PspOMI; N, NsiI; O1, oligo1; O2, oligo 2; O3, oligo 3; O4, oligo 4. (B) To detect correct homologous recombination at 5′, 5 clones of ES cells were digested with PspOMI and hybridised to probe 5e1 (left panel), 3 clones gave the expected band at 14.9 kb. For the 3′flank, cells were digested with NsiI and hybridised to probe 3e1 (central panel), all 5 gave the expected band at 8.7 kb. To detect single insertion, the clones were digested with NsiI and hybridised to probe Puro and all 5 gave a single band at the correct size of 8.7 kb (right panel). * denotes clone 2 chosen for breeding (A-D09). (C) Genotyping analysis was carried out by PCR on pups bred from clone 2 in (B). (Left panel) The 396 bp fragment (arrow) amplified by oligos 1 and 2 denotes the presence of heterozygous/homozygous humanised alleles. Wild type allele is not detected. (Right panel) The 167 bp fragment (arrow) amplified by oligos 3 and 4 denotes the presence of heterozygous and homozygous wild type alleles. In both PCR reactions, an internal control fragment of 585 bp was included. Marker bands of 15 bp and 7000 bp are shown. NC, negative control.

