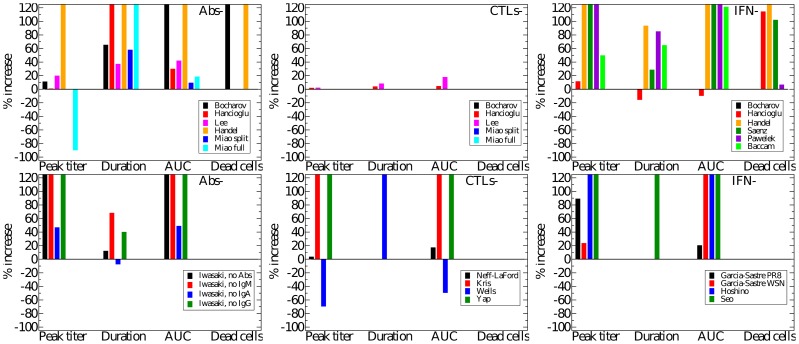
Figure 6. Immune kinetics and its effect on disease severity.
The percent increase in peak viral titer, symptom duration, AUC of viral titer, and proportion of dead cells when the effect of Abs (left), CTLs (centre), or IFN (right) is removed in various mathematical models (colour-coded) of influenza infections (top row) or from experimental data (bottom row). Note that a negative percent increase for a given measure indicates a decrease of that measure in the absence of that immune response.

