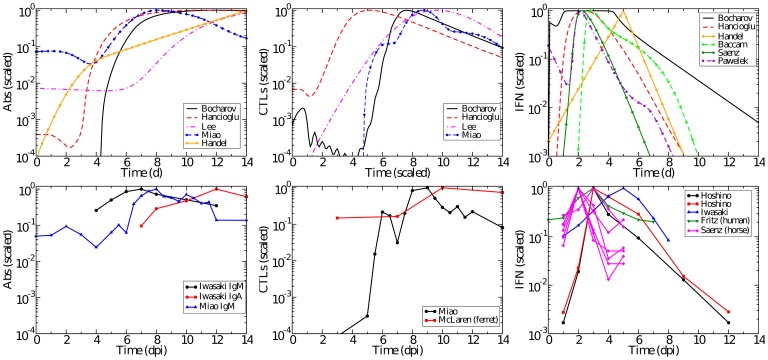
Figure 7. Time course of Abs, CTLs, and IFN.
The time courses predicted by models (top row) and experimentally determined time courses (bottom row) for Abs (left), CTLs (centre), and IFN (right). All data has been scaled to peak at 1.0. Experimental data are collected from mice unless otherwise indicated.

