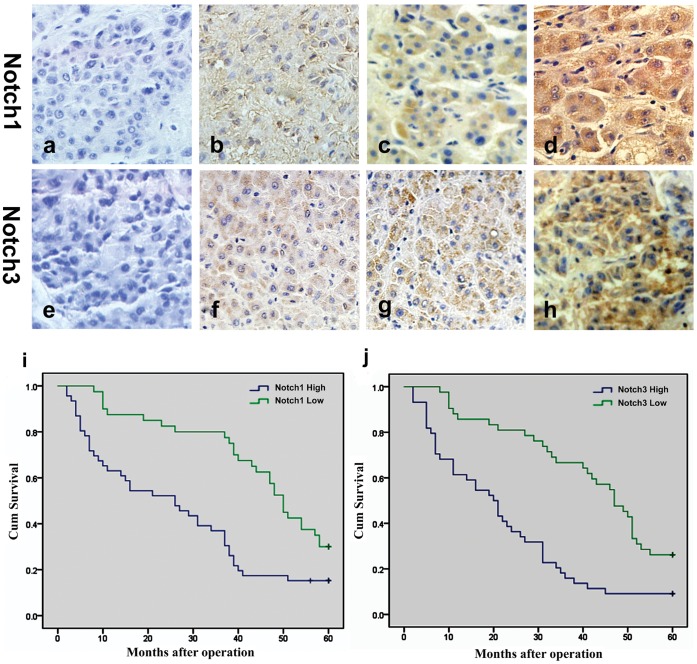
Figure 1. Expression of Notch1 and Notch3 in HCC tissues and Kaplan-Meier statistical analyses of postoperative survival curves according to Notch1 and Notch3 expression.
Notch1 expression in HCC tissues (a–d): (a) negative, (b) weakly positive, (b) moderately positive, (d) strongly positive. Notch3 expression in HCC tissues (e-h): (e) negative, (f) weakly positive, (g) moderately positive, (h) strongly positive. (i) Kaplan-Meier statistical analyses of postoperative survival curves according to Notch1 expression; (j) Kaplan-Meier statistical analyses of postoperative survival curves according to Notch3 expression.

