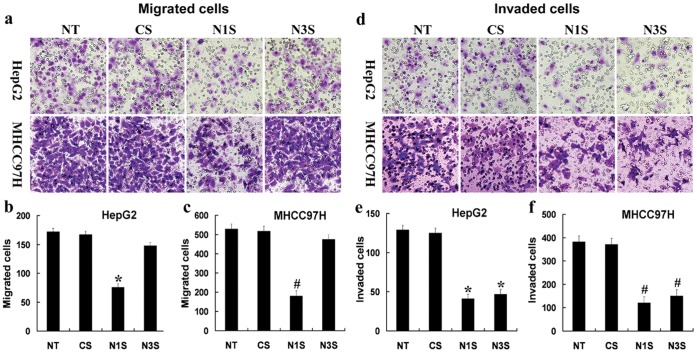
Figure 2. Down-regulation of Notch1 or Notch3 can decrease the migration and invasion of HepG2 and MHCC97H cells in vitro.
(a–c) Migrated HCC cells analyzed by transwell assays compared with siRNA controls. (d–f) Invaded HCC cells analyzed by transwell assays compared with siRNA controls. The data are presented as the mean ± SD, *P<0.05 compared with control siRNA-transfected HepG2 cells; #P<0.05 compared with control siRNA-transfected MHCC97H cells. NT: No transfection; Cs: control siRNA transfection; N1s: Notch1 siRNA transfection; N3s: Notch3 siRNA transfection.

