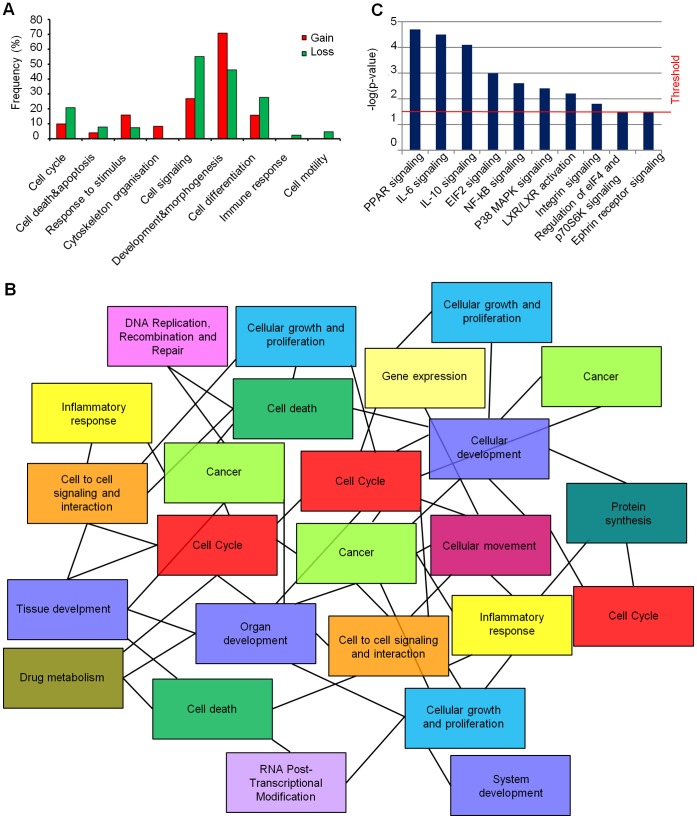
Figure 4. Functional characterization of cytogenomic landscapes.
(A) Categories of genes determined by GO analysis and included in gain and loss regions. Each category is associated to a percentage of frequency which was calculated on the ratio between the number of genes associated to a specific category and the total number of genes associated to at least one GO term. (B) Tree topology of overlapping network established using IPA software. Genes in new “exclusive” gain and loss regions identified in GSCs profiles of aCGH were assigned to gene networks which were strictly interconnected one to each other and revealed cancer-relevant annotations. Different genes can be grouped in several networks, underlying the same mechanism (i.e. cancer or cell cycle). (C) New ‘exclusive’ CNA region-associated pathways. Each pathway is associated with a p-value (calculated by Ingenuity Pathway Analysis, IPA, software), which represents the probability that such association could have occurred by chance.

