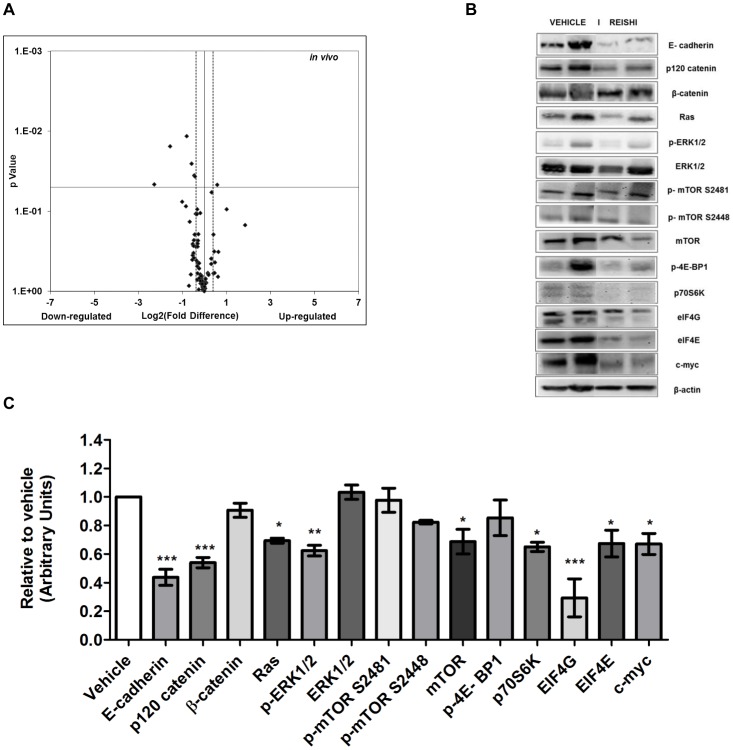
Figure 4. Reishi reduces PI3K/AKT/mTOR and MAPK pathway gene and protein expression.
A. RT2 PCR array designed to profile the expression of PI3K/AKT pathway-specific genes was performed using 500 ng of tumor extracted RNA, according to manufacturer’s instructions (SA Biosciences). Volcano plot show effects on gene expression analyzed at −1.3≥1.3 log2-fold change (dashed line). Down-regulated genes are to the left of the vertical black line while up-regulated genes are to the right. Statistically significant regulated genes are above the horizontal black line at P<0.05. B. Equal amount of protein from each sample was used for western blot analysis with antibodies against key IBC proteins. Each lane depicts a representative tumor lysate from a different mouse of either vehicle or Reishi treatment. C. Quantification was done using integrated density units, normalized to β-actin and relative to vehicle. Columns show means ± SEM. Reishi downregulates the expression of key IBC proteins in vivo. *P<0.05, **P<0.01.

