
Figure 4. GFP mRNA is not expressed in Oct4GFP and NanogGFP transgenic MT/ret, MMTV-PyMT or MMTV-Neu tumors.
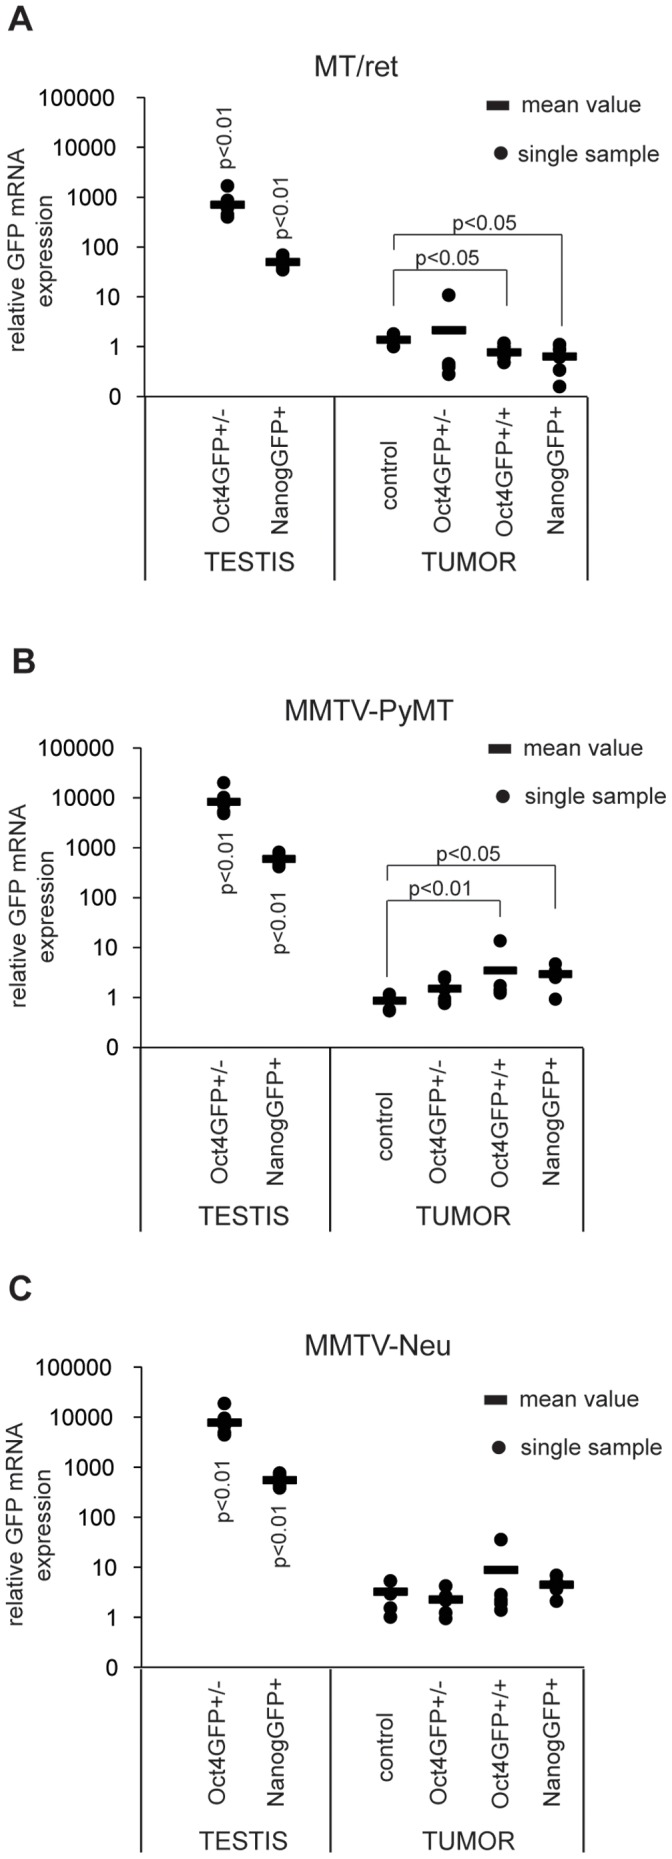
Relative GFP mRNA expression levels of (A) MT/ret, (B) MMTV-PyMT and (C) MMTV-Neu compound tumors with indicated genotypes and Oct4GFP+ and NanogGFP+ testes were analysed by qPCR. For each tumor model, GFP mRNA expression levels of compound tumors and Oct4GFP+ and NanogGFP+ testes were compared to one control tumor which was set to 1. Circles represent individual samples, the bar indicates the mean value of all samples. The number of analysed samples is as follows: testes: Oct4GFP+/− n = 7, NanogGFP+ n = 5. (A) MT/ret: control n = 4, Oct4GFP+/− n = 6, Oct4GFP+/+ n = 6, NanogGFP+ n = 6 (B) MMTV-PyMT: control n = 5, Oct4GFP+/− n = 6, Oct4GFP+/+ n = 6, NanogGFP+ n = 6 (C) MMTV-Neu: control n = 5, Oct4GFP+/− n = 5, Oct4GFP+/+ n = 5, NanogGFP+ n = 9.