
Figure 1. Computer model geometry.
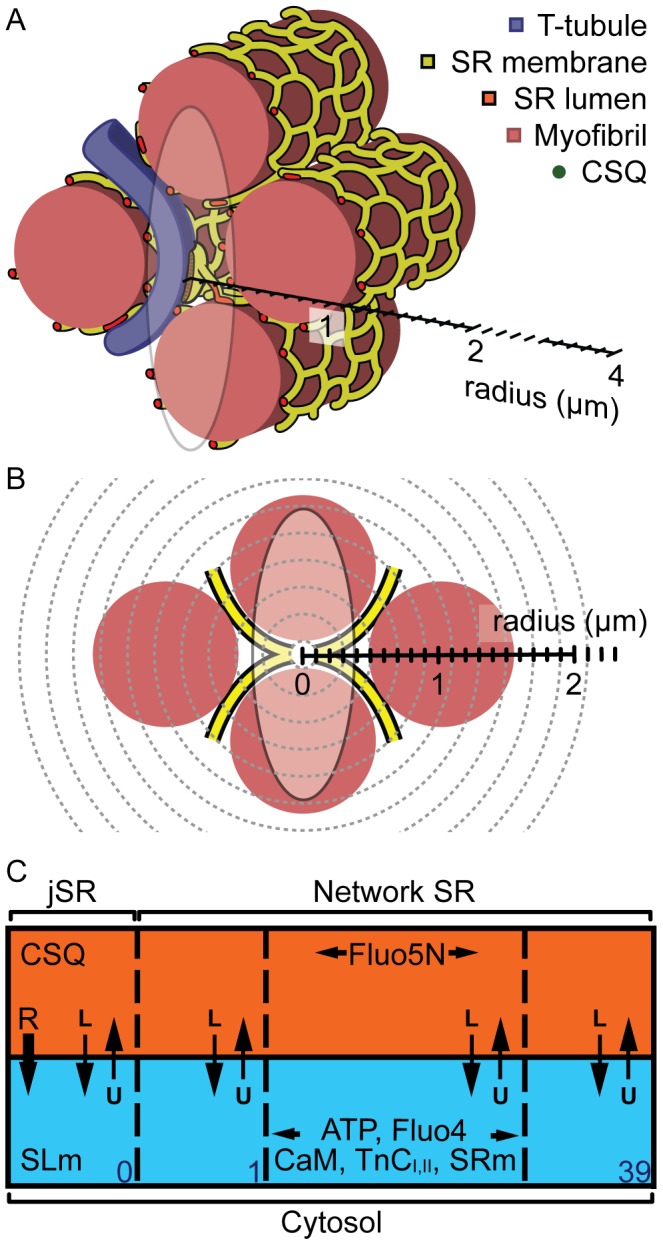
(A) shows a region of a cardiac myocyte and presents the size of a typical junction relative to a confocal PSF and the computer model. A transverse tubule (purple) extends in between myofilaments (pink) that are wrapped by network of SR tubules (yellow surface, red lumen). A flattened disc of SR wraps around the T-tubule to form a Ca release junction. The size of a typical confocal PSF is shown by an ellipse in x-z orientation, at 2·FWHM. (B) shows the transverse, stylised view of (A), where the SR can be seen as an ‘X’ shape that curves around the myofibrils. The jSR is shown as a white circle and assumed to be in the centre of the PSF (opaque ellipse). The spherical mesh of the computer model is also shown (grey dashed lines), with the radius at 4 µm, which should be sufficiently large to capture a Ca spark without boundary effects. (C) shows a simplified diagram of the computer model elements (0≤i≤39) and the two compartments: the cytosol (blue) and SR (orange). The locations of mobile and immobile Ca buffers are shown. See text and Table 1 for details.