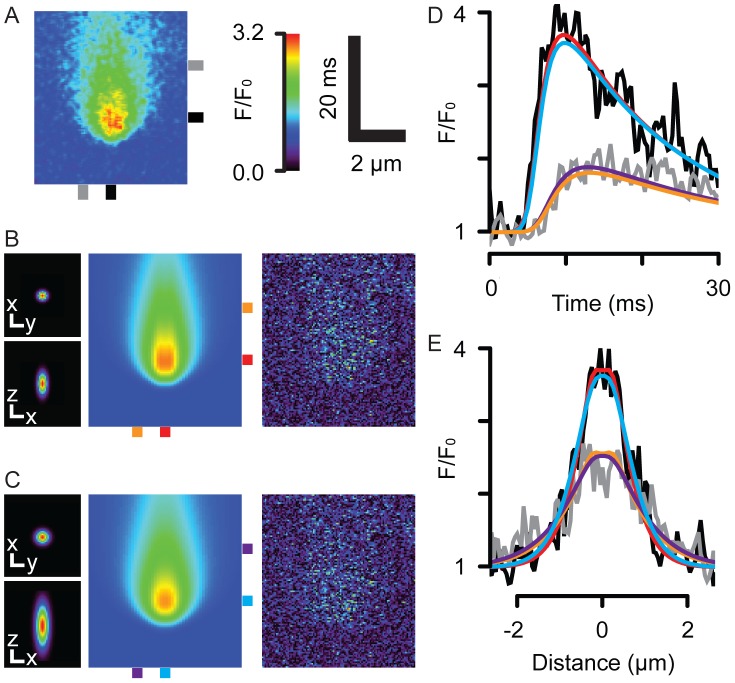
Figure 3. Simulation and fit of a Ca spark with on-coverslip and on-cell PSFs.
(A) shows a line-scan image of a measured Ca spark. From left to right, (B) shows the on-coverslip PSF in x-y (top) and x-z (bottom) view (scale bars show 0.5 µm), the simulated Ca spark and absolute difference between the simulated and recorded events. The mean of the difference image was −0.06. (C) shows a similar dataset, but for an on-cell PSF, where the mean of the difference image was −0.07. The goodness of fit can be appreciated in the time and distance profiles are shown in (D) and (E), respectively, colored by the marks beside the Ca spark images.

