
Figure 4. Ca-Fluo-4 and release flux associated with Ca spark.
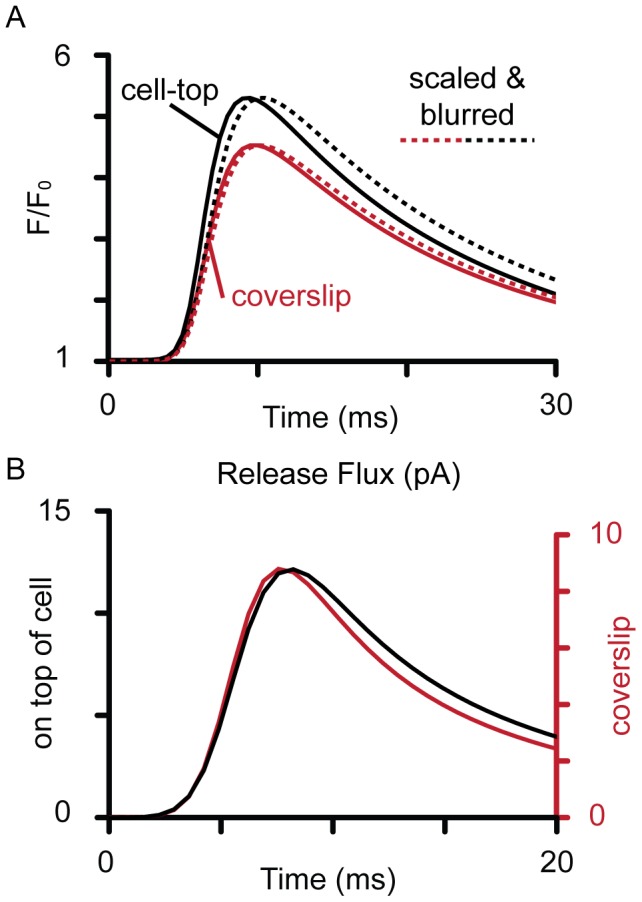
The (A) time profiles of the unblurred calculated Ca-Fluo-4 signals for Ca sparks at the top of the cell (black) and near the coverslip (red). The dashed lines show the corresponding simulated Ca sparks (blurred Ca-Fluo-4 signals) scaled to the amplitudes of the un-blurred signals to allow comparison of the time-courses. (B) shows the release flux required to produce the fitted simulated Ca sparks shown in Fig. 3 and 4A, where a larger current was required when optical blurring was more severe (i.e. if the Ca spark had originated from near the cell top).