
Figure 5. Ca blinks and [Ca]SR signals.
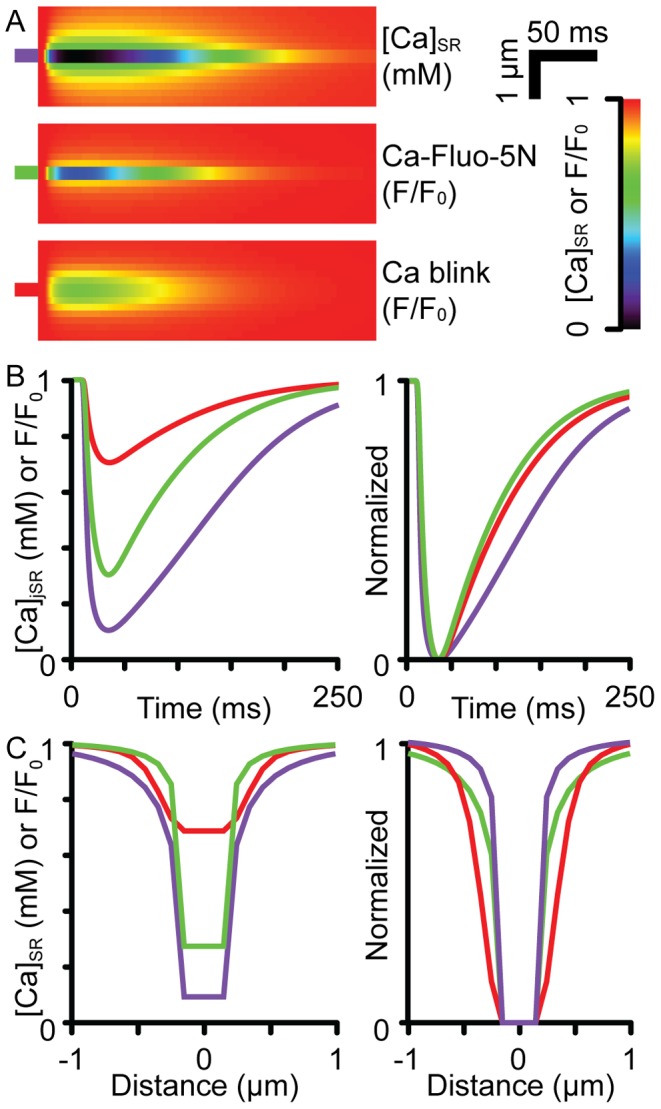
(A) shows the simulated line-scan images of [Ca]SR (purple), Ca-Fluo-5N (green) and Ca blink (blurred Ca-Fluo-5N, red) signals when the Ca sparks were simulated with an cell-top PSF. Left panels in (B) and (C) show the time and spatial profiles through the minimum Ca blink intensity, respectively. The right panels show scaled versions of the profiles.