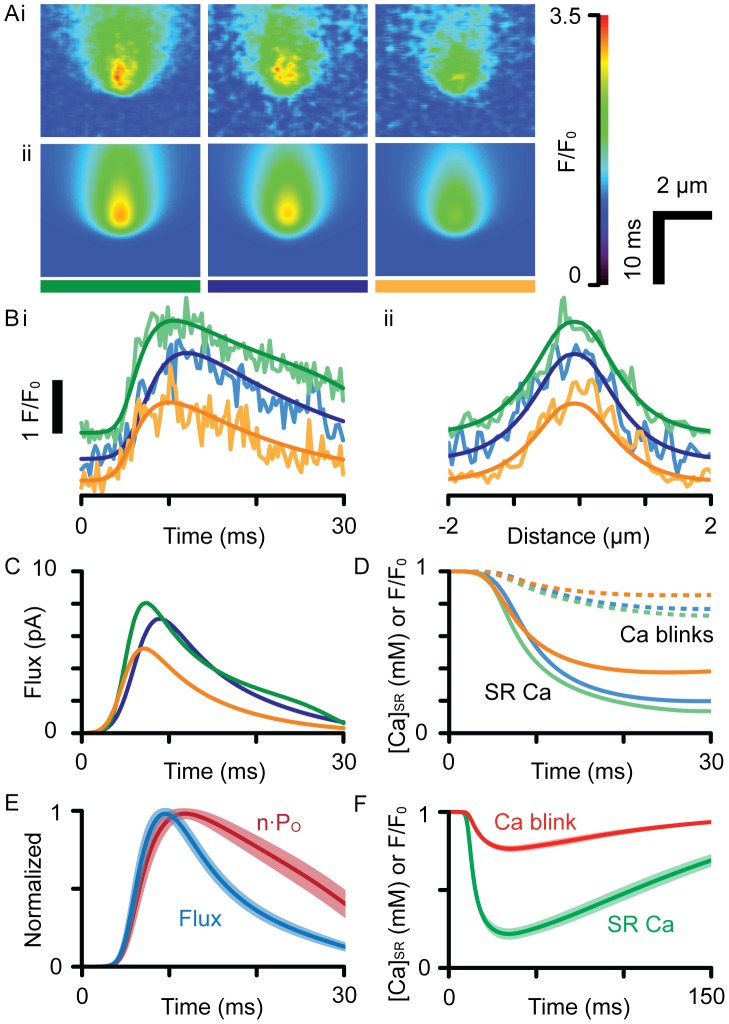
Figure 6. Analysis of recorded Ca sparks.
(A) shows 3 examples of (i) recorded and (ii) simulated Ca sparks analyzed with a cell-top PSF. These events were chosen for their high signal-to-noise ratio and high amplitude, which suggests they are in-focus. (B) shows the (i) time and (ii) spatial profiles of the recorded and fitted (smooth lines) datasets, color-coded by the bars shown in (A). The events have been offset for clarity. (C) shows the flux responsible for each event, which was used to calculate the time-course of n·PO. (D) shows the time-course of [Ca]SR in the junction (solid lines), overlaid with the corresponding Ca blink signals (dashed lines). (E) shows the time-courses of release flux and n·PO averaged from fitting a population of Ca sparks (n = 14), where the shaded regions show one S.E.M. For all events, RyRs were open longer than release flux duration, which were 24.0±13 vs. 11.2±2.2 ms, respectively, when measured from the start to the time at half maximal decay. (F) shows the corresponding average [Ca]jSR and Ca blink time-courses with the shaded areas showing one S.E.M.

