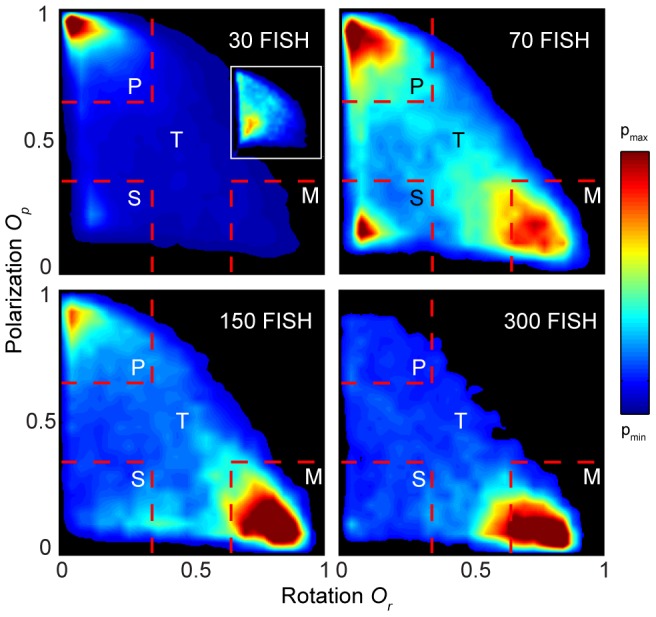
Figure 2. Density plots of polarization vs. rotation from experiments.

The data shown are averaged over all replicates for each of the groups of 30, 70, 150, and 300 golden shiners. The order parameter space is divided into four regions—swarm (S), polarized (P), milling (M), and transition (T)—each being characterized by the dominant dynamical state of the fish school in that particular region. Different values of pmin and pmax were used for each group size to emphasize the density patterns and regions with no data are colored black. The insert in the 30 fish plot shows the density plot from an experiment with 30 fish and the tank area reduced to one tenth of the original.
