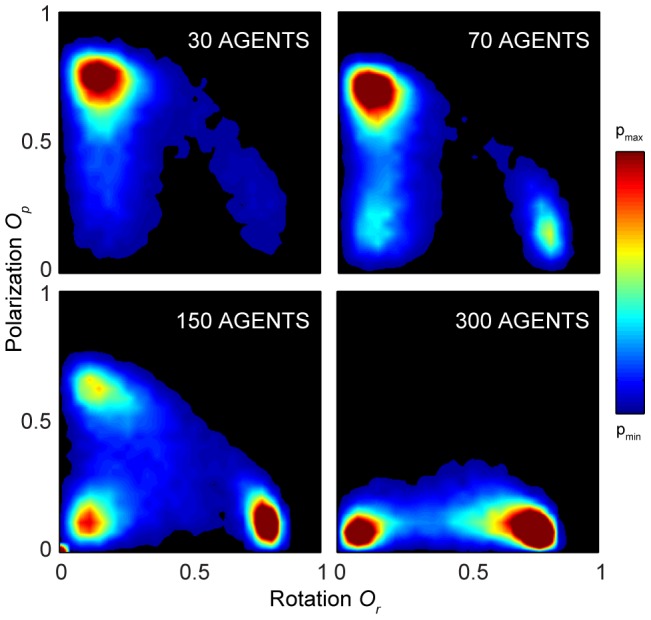
Figure 3. Density plots of polarization vs. rotation from simulations.

The data shown are from simulations with 30, 70, 150, and 300 agents, employing a constant-speed agent based simulation model of collective behavior where no boundary is present (See Methods for simulation details). Regions with no data are colored black. As for the experimental data, the milling state grows in stability with group size.
