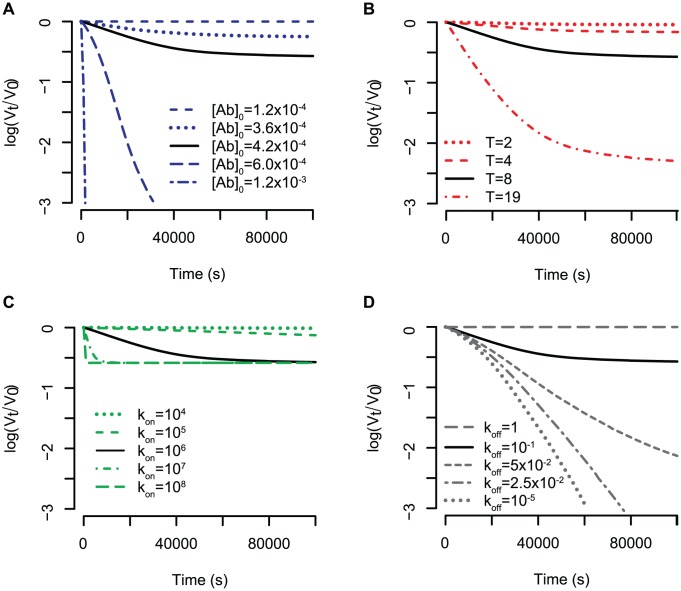
Figure 3. Influence of different parameters on the kinetic neutralisation curves.
(A) Antibody starting concentration. The starting concentration of spikes is constant for all graphs,  . The stoichiometry of entry is
  and the stoichiometry of trimer neutralisation
  . The binding constants are all
  and the dissociation constants are all
  . (B) Stoichiometry of entry. The parameters are the same as for (A) but the antibody starting concentration is
  . (C) and (D) Influence of the ratio between binding and dissociation constant in case all binding constants have the same value
  and all dissociation constants have the same value
  . In (C) the ratio between the binding and dissociation rates is kept constant at
  whereas in (D) the binding constant is kept constant at
  .
.

