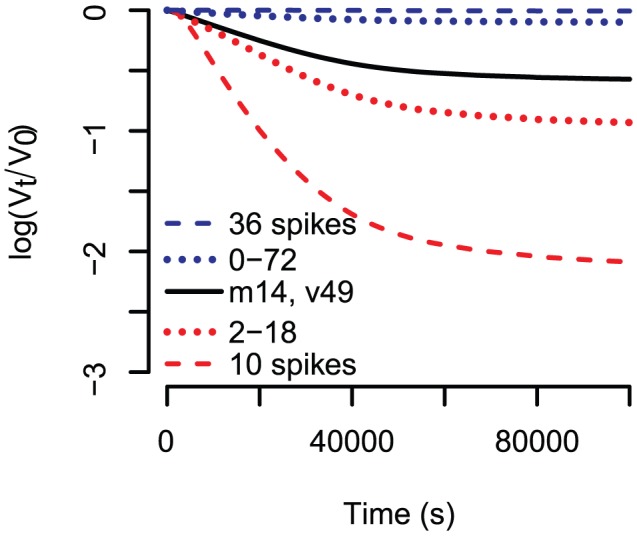
Figure 6. Kinetic neutralisation curves for different spike number distributions.

Binding constants are all  , dissociation constants are all
  , the stoichiometry of entry is
  and the stoichiometry of trimer neutralisation is
  . Red curves have a spike number distribution with mean 10, where all virions in the case of the dashed line have exactly 10 spikes and in case of the dotted lines have an equal probability to have 2,3…, 18 spikes. The black curve underlies the HIV specific discretised Beta distribution with mean 14 and variance 49. The spike number distributions for the blue curves have mean 36, where the one for the dashed line has only virions expressing 36 spikes and the dotted line has 0–72 spikes.
