
Figure 5. Circadian expression profiles of 14 tissue-specific TFs.
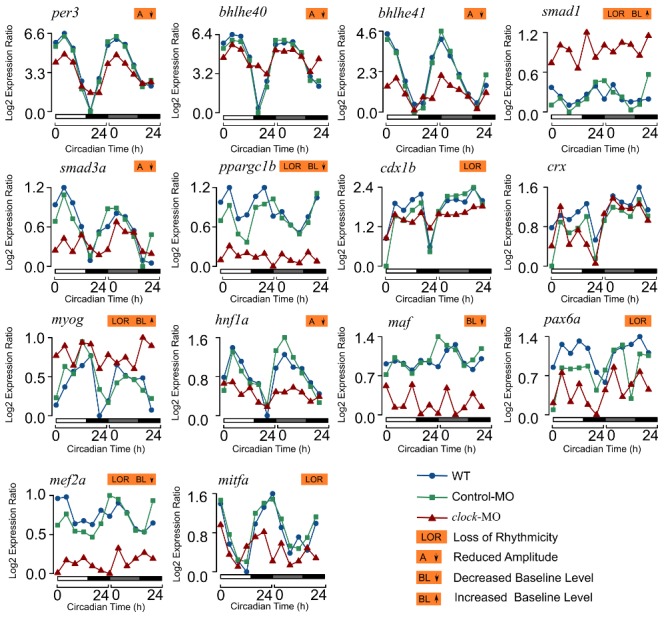
The expression levels of bhlhe40/41 and per3 together with 11 circadian tissue-specific TFs were measured by real-time PCR in 5 dpf clock morphants (red) compared to WT (blue) or control (green) morphants. The lowest log2-transformed expression level for each TF was normalized to zero. The reduction in oscillation amplitude, loss of rhythmicity, and increase or decrease in baseline expression levels in clock morphants compared to WT or control morphants were annotated for each gene.