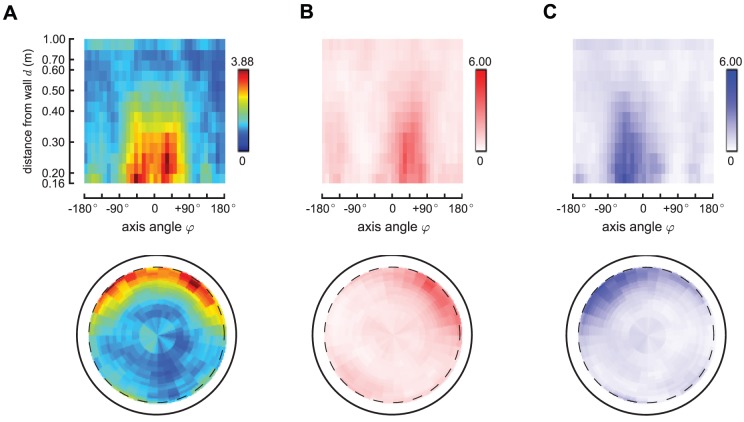
Figure 4. Estimated saccade generation rates.
This picture shows basic statistics of the processed data. Panel A shows the estimated saccade rate in polar coordinates (i) and fly-centered spatial coordinates (ii), indicated in the text as  . This density is obtained by taking the raw number of saccades in each cell
  (Figure 1, Panel E), normalizing by the time spent in each cell
  (Figure 1, Panel D), and then compensating for the interacting nature of the Poisson processes. Panels B–C show the rates for left and right saccades (
 and
and  , respectively), which we plot in red in Panel B (left saccades) and in blue in panel C (right saccades). Note that the left and right saccade ratios appear roughly symmetric.

