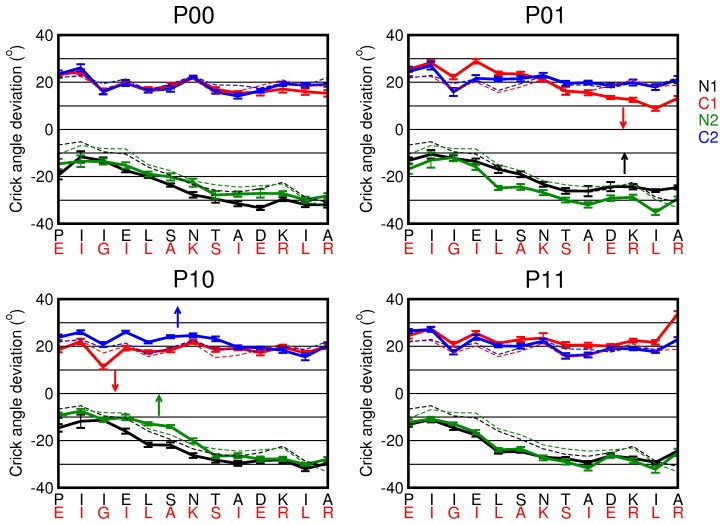
Figure 7. Deviation of the ideal Crick angles for the four piston states.
The Crick angle deviation is plotted as a function of residue in the N and C-helices for the  ,
,  ,
,  and
and  states. The error bars indicate the variation over 40 snapshots. The dashed lines represent the Crick angle deviations as measured for the NMR structure of wild-type Af1503-HAMP (PDB-code 2L7I). There are little differences between the states.

