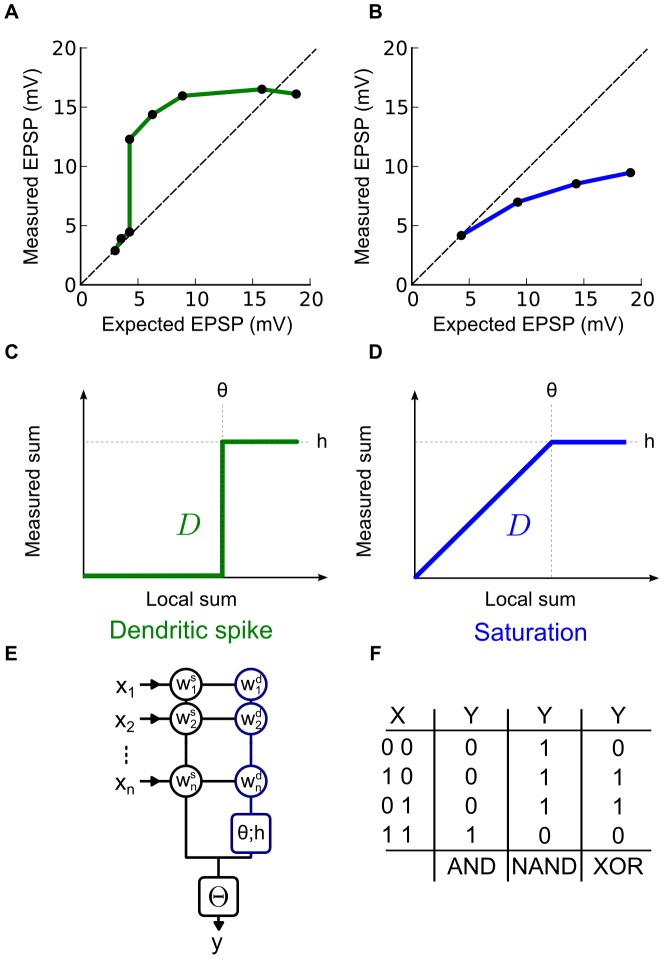
Figure 1. Two types of local dendritic non-linearities.
(A–B) The x-axis (Expected EPSP) is the arithmetic sum of two EPSPs induced by two distinct stimulations and y-axis (Measured EPSP) is the measured EPSP when the stimulations are made simultaneously. (A) Observations made on pyramidal neurons (redrawn from [13]). Summation is supra-linear and sub-linear due to the occurrence of a dendritic spike. (B) Â Observations made on cerebellar interneurons (redrawn from [10]). In this case summation is purely sub-linear due to a saturation caused by a reduced driving force. (C) Â The activation function modeling the dendritic spike type non-linear summation: both supra-linear and sub-linear on  . (D) Â The activation function modeling the saturation type non-linear summation: strictly sub-linear on
  . (E) Structure and parameters of the neuron model:
  and
and  are binary variables describing pre and post-synaptic neuronal activity; in circles are two independent sets of non-negative integer-valued synaptic weights respectively for the linear (black) and the non-linear integration (blue) sub-units; in the blue square,
  and
and  are the non-negative integer-valued threshold and height that parameterize the dendritic activation function
  ; in the black square
  is a positive integer-valued threshold determining post-synaptic firing. (F) Â Truth tables of three Boolean functions for
  inputs: AND, NAND, and XOR. The first column gives the possible values of the input vector
  ; the other three columns give the binary outputs
  in response to each
  for the three functions considered.

