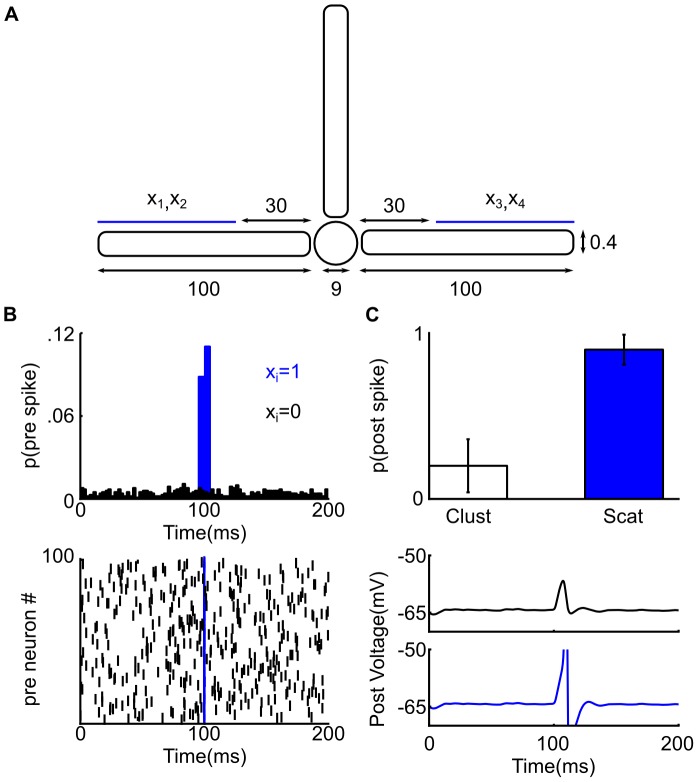
Figure 5. Cerebellar stellate cell interneurons can implement the dual feature binding problem.
(A) A schematic representation of the biophysical model, the circle represents the soma and the 3 cylinders correspond to dendrites, their size is expressed in  m, the blue bars represent the region where the four cell assemblies
  , each made of 100 pre-synaptic neurons, makes contacts every
  m, between 30 and 100
  m away from the soma.
  and
and  make contact on the the left dendrite, whereas
  and
and  make contact on the right dendrite. (B) Above, a spike density plot of the cell assembly
  , each made of 100 pre-synaptic neurons, when
  (blue) or
  (black). Below, the corresponding raster plot. (C) Above, the probability of a post-synaptic spike averaged over 10 trials, when two scattered inputs are active (Scat:
  ,
,  ,
,  , or
, or  ) or when two clustered inputs are active (Clust:
  or
or  ). The bars correspond to the variance of the binomial distribution for p(post spike). Below, somatic voltage traces in clustered (black) or in scattered (blue) condition. Note that our model of cerebellar stellate cells fires significantly more often (Binomial test,
 ) when inputs are scattered over the dendritic tree.

