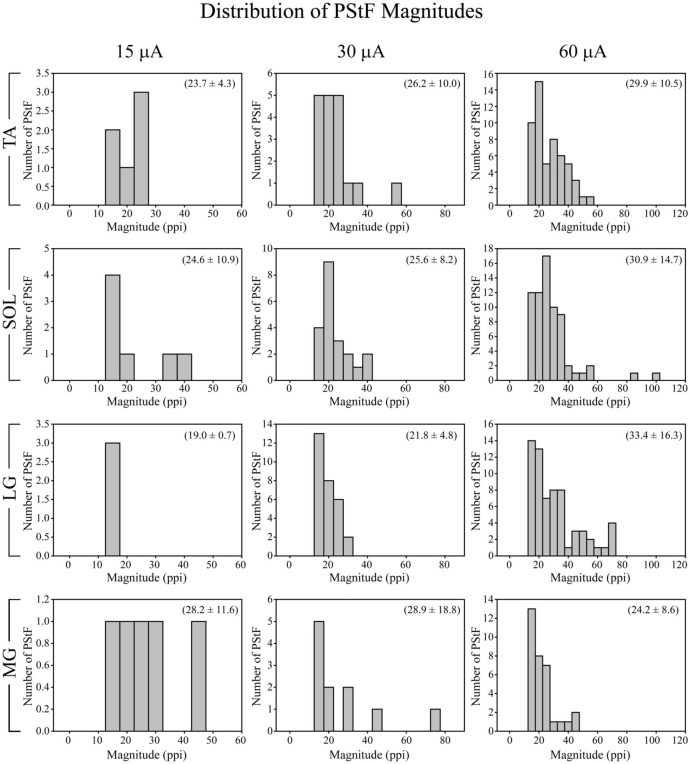
Figure 4.
Distribution of PStF magnitudes for ankle muscles at 15, 30, and 60 μA stimuli. The magnitudes are expressed as peak percent increase (ppi) above baseline. The values given in parentheses for each graph represent the mean ± SD of the magnitude of the PStF. Muscle abbreviations are the same as in Figure 1.

