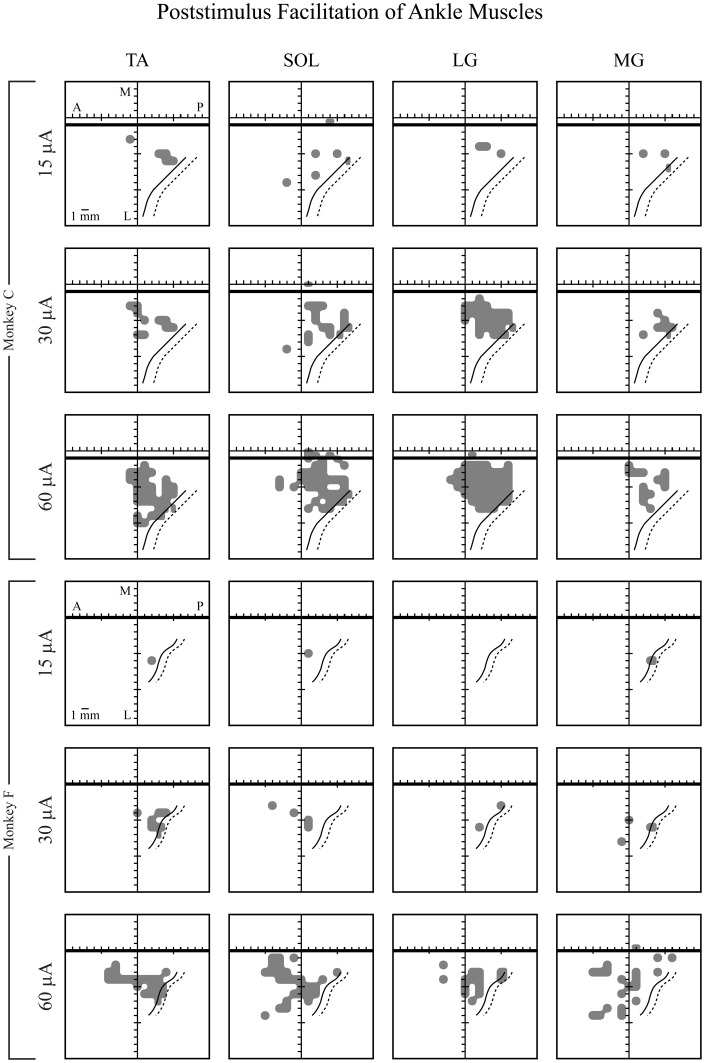
Figure 6.
Maps of individual ankle muscle representations in hindlimb primary motor cortex in two monkeys (F and C), represented in two dimensions after unfolding the medial wall and central sulcus. Maps of hindlimb muscles were based on PStF effects at 15, 30, and 60 μA. Heavy horizontal black line: midline, above the heavy black line represents the bank of the medial wall of the hemisphere. Solid black curved line: central sulcus. Dotted black curved line: fundus of the central sulcus. A, anterior; P, posterior; M, medial; and L, lateral. Muscle abbreviations are the same as in Figure 1.

