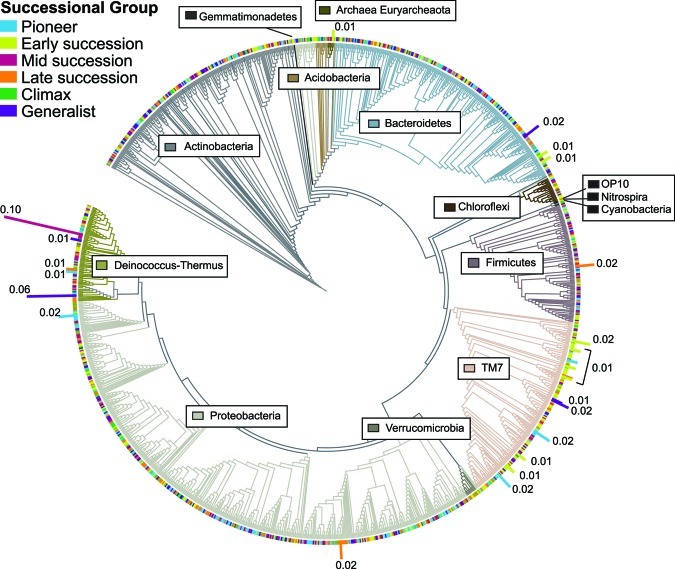
FIG 6 .
Distribution and representation of apple flower microorganisms. The tree includes OTUs identified at least to the class level. The branch shading corresponds to the different phyla detected (phylum names indicated in boxes). The branch tip colors correspond to the successional groups of each taxon (OTUs with 97% tag sequence identity). The height and label of the colored bar indicate the relative abundance of each OTU in the data set, and unlabeled OTUs have relative abundances below 0.01. Note that Fig. 6 is a tool for visualizing the representation of OTUs among phyla and is not intended to depict evolutionary relationships.

