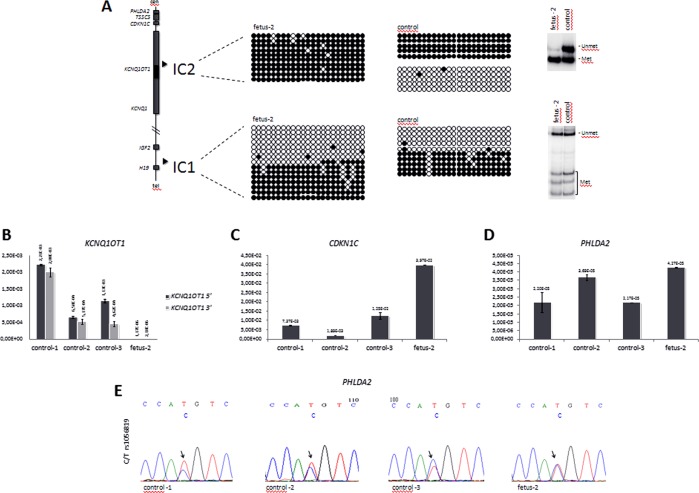
Figure 2.
DNA methylation and gene expression analyses. (A) DNA methylation analysis of IC1 and IC2 in fetus 2 amniocytes by bisulphite sequencing and COBRA. A diagram representing the main genes and the positions of the ICs of the 11p15.5 cluster is shown on the left. For bisulphite sequencing (middle), DNA samples of fetus 2 and control amnyocites were treated with sodium bisulphite, amplified by PCR with IC1- or IC2-specific primers, cloned and sequenced; 23 CpGs of IC2 and 23 CpGs of IC1 (CCCTC-binding factor (CTCF) target site 6) are shown. Each line corresponds to a single template DNA molecule, and each circle represents a CpG dinuclotide. Filled circles designate methylated cytosine, and open circles correspond to unmethylated cytosines. For COBRA (right), 1 µg DNA was treated with sodium bisulphite, PCR-amplified and incubated with the restriction enzyme BstUI, as described.19 The slow-migrating bands correspond to the non-methylated allele, and the fast-migrating bands correspond to the methylated allele. Note, that IC2 is hypermethylated, consistent with the deletion of the non-methylated paternal allele, while IC1 methylation is normal. (B–D) Gene expression analysis. Levels of KCNQ1OT1 (B), CDKN1C (C), and PHLDA2 (D), RNAs were measured by quantitative real-time RT-PCR in fetus 2 and control amniocytes. Values were normalised against those of GAPD. Note, that KCNQ1OT1 is silenced, while CDKN1C and PHLDA2 are activated in the amniocytes of fetus 2. (E) Allele-specific expression of PHLDA2. 1 μg RNA derived from the amniocytes of fetus 2, and three controls was retrotranscribed. The PHLDA2 cDNA was PCR-amplified and sequenced. The electropherograms show the DNA sequence around SNP rs1056819. Note, that the two parental PHLDA2 alleles are equally expressed in fetus 2, but only the biased expression of one allele is present in the controls.

