Fig. 4.
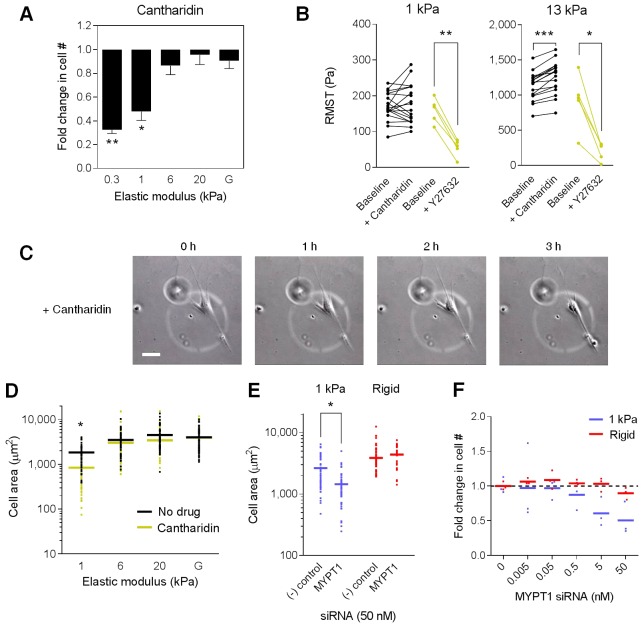
Enhancing actomyosin tension leads to cell retraction and reduced proliferation on soft matrices. (A) Effect of cantharidin (1 µM) on cell proliferation across five stiffness conditions. Fold change indicates ratio of cell number in drug versus no drug samples after 72 hours. Data are means ± s.e.m. (n = 5). One-way ANOVA followed by Tukey's test: *P<0.01, **P<0.0001 versus rigid (glass, G) condition. (B) RMST at baseline and following 2 hours of cantharidin (1 µM) or 45 minutes of Y27632 (10 µM) treatment. Paired observations of individual cells (cantharidin, n = 17; Y27632, n = 5) are connected. Paired t-test: *P = 0.0059, **P = 0.0002, ***P<0.0001 versus baseline RMST. (C) Time-lapse sequence of a fibroblast on a 1 kPa substrate following addition of cantharidin (0.3 µM). Images are at 200× magnification. Scale bar: 50 µm. (D) Effect of cantharidin (1 µM) on mean cell area (n≥29). One-way ANOVA followed by Tukey's test: *P<0.0001 versus rigid condition. (E) Effect of MYPT1 and non-targeting [(−) control] siRNA on cell area. Means and individual data points (n≥22) are shown. Student's t-test: *P<0.0001 versus (−) control. (F) Fibroblasts on 1 kPa and rigid substrates were transfected with siRNA targeting MYPT1 and cultured for 6 days. Fold change in cell number is relative to the no siRNA condition for each stiffness condition. Means and individual data points (n = 3) from one experiment are shown.

