
Fig. 2.
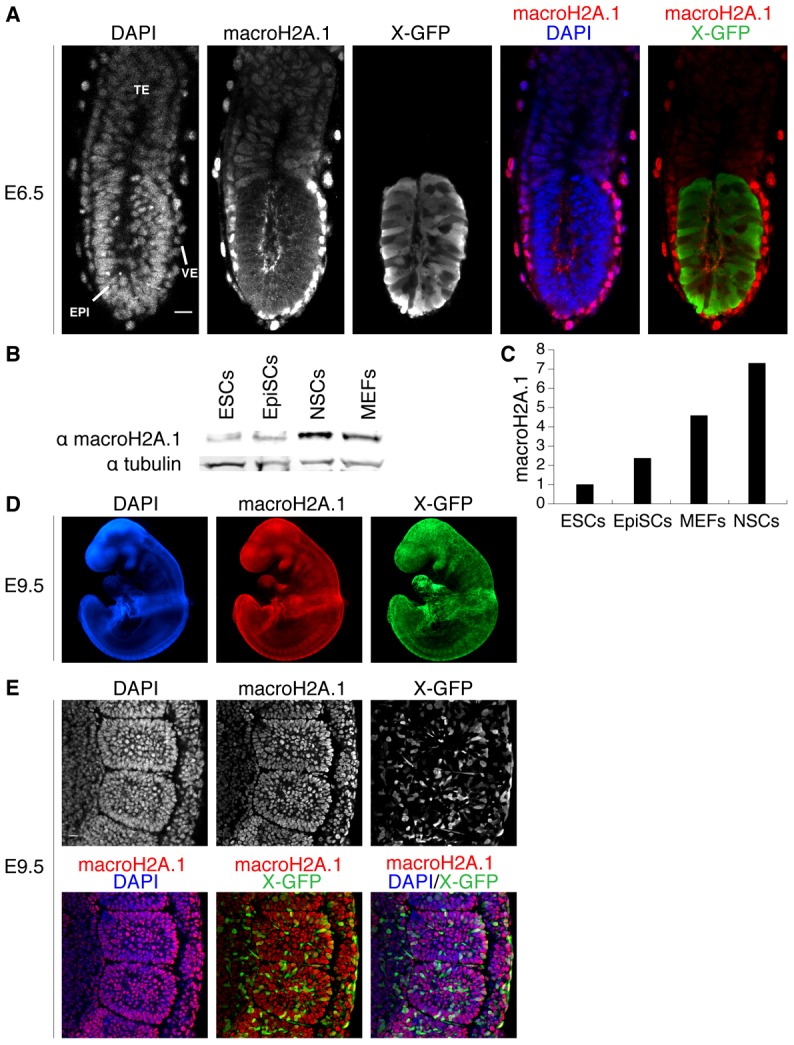
MacroH2A.1 becomes highly expressed during somatic lineage development. (A) E6.5 female X-GFP mouse conceptus wholemount immunofluorescence against macroH2A.1 (red in merge panel) and GFP (green in merge panel). MacroH2A.1 is highly expressed in the visceral endoderm (VE) and to some extent in the extra embryonic ectoderm (TE) but is not detected in the epiblast (EPI), precursor of all somatic lineages (mosaic X-GFP expression due to random X chromosome inactivation). DAPI is in blue. Images are projected confocal Z-sections. (B) Western blot analysis of macroH2A.1 in ESCs, EpiSCs, NSCs and MEFs. All cells are female. Tubulin was used as a loading control. (C) Quantification of western blot analysis shown in B. MacroH2A.1 signal was normalized to tubulin and ESCs levels set to 1. MacroH2A.1 expression is lowest in ESCs and increases with the differentiated state in EpiSCs, MEFs and adult NSCs. (D) E9.5 female X-GFP mouse embryo wholemount immunofluorescence against macroH2A.1 (red) and GFP (green). MacroH2A.1 is expressed throughout all tissues of the embryo at this stage. DAPI is in blue. Images acquired using epifluorescence microscopy. (E) E9.5 X-GFP mouse embryo immunofluorescence against macroH2A.1 (red) and GFP (green) showing a portion of the lateral plate mesoderm (including somites). Nuclear macroH2A.1 is detected in all somatic cells. Mosaic X-GFP expression is due to random X chromosome inactivation. DAPI is in blue. Images are projected confocal Z-sections. Scale bars: 20 µm.