
Fig. 3.
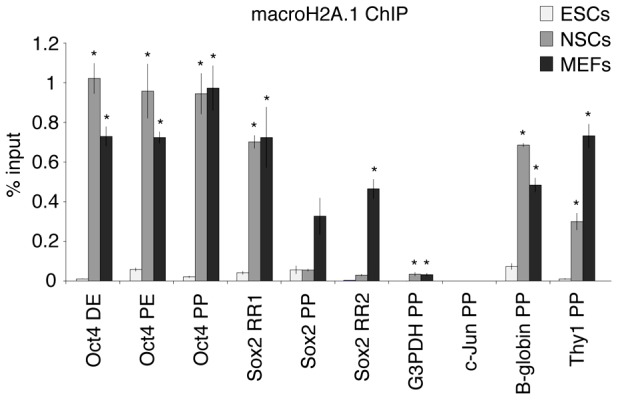
MacroH2A.1 marks chromatin of regulatory sequences of repressed pluripotency genes in differentiated cells. MacroH2A.1 ChIP analysis of pluripotent and lineage-specific gene regulatory regions in pluripotent (ESCs, light gray), and somatic cells (NSCs, gray; MEFs, dark gray). DE, distal enhancer; PE, proximal enhancer; PP, proximal promoter; RR1, regulatory region 1; RR2, regulatory region 2. Error bars depict the s.e.m. (n = 3). There were significant differences between ESCs and NSCs or MEFs, as indicated; *P<0.05; t-test one tail, type 3.