Fig. 5.
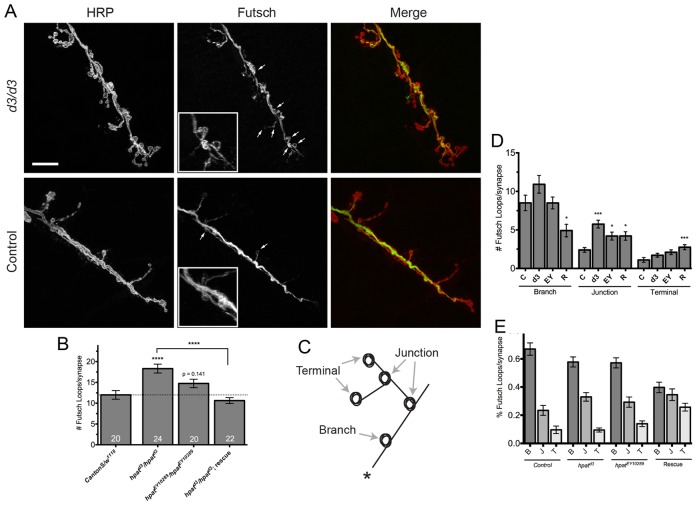
HPat regulates structure of the presynaptic microtubule cytoskeleton. (A) Representative images of muscle 6/7 NMJs from abdominal segment A3 labeled with antibodies against presynaptic HRP (red) and Futsch (green) to show microtubule loops. Arrows indicate examples of Futsch loops. The inset in the hpatd3/hpatd3 panel is a magnified region showing an abnormal cluster of Futsch-positive loops. Scale bar: 20 µm. (B) Quantification of the number of Futsch-positive loops per NMJ at muscle 6/7 clefts. Unless otherwise indicated, asterisks indicate statistical significance compared to control NMJs (***P<0.001; one-way ANOVA; Tukey’s post-hoc test). (D–E) Genotypes here are as follows: “C” (CantonS/w1118; n = 20) control; “d3” (hpatd3/hpatd3; n = 24); “EY” (hpatEY10289/hpatEY10289; n = 20); and “R” (hpatd3/hpatd3; P21M20/P21M20; n = 24) rescue. (C) Cartoon diagram showing three regions of the NMJ where Futsch loops were typically observed. The regions quantified were the main synaptic arbors (“Branch” or “B”), terminal synaptic boutons (“Terminal” or “T”), and junctions where two or more branches meet (“Junction” or “J”). In this figure, the synaptic arbor marked by a “*” would be the site of innervation. (D) Quantification of the location of Futsch-positive loops in hpat mutants in each of the regions shown in C. The most significant increase is observed at the point where two synaptic arbors meet (*P<0.05; ***P<0.001; Kruskal–Wallis; Dunn’s post-hoc test). (E) The relative distribution of Futsch-positive loops in each indicated synaptic region.

