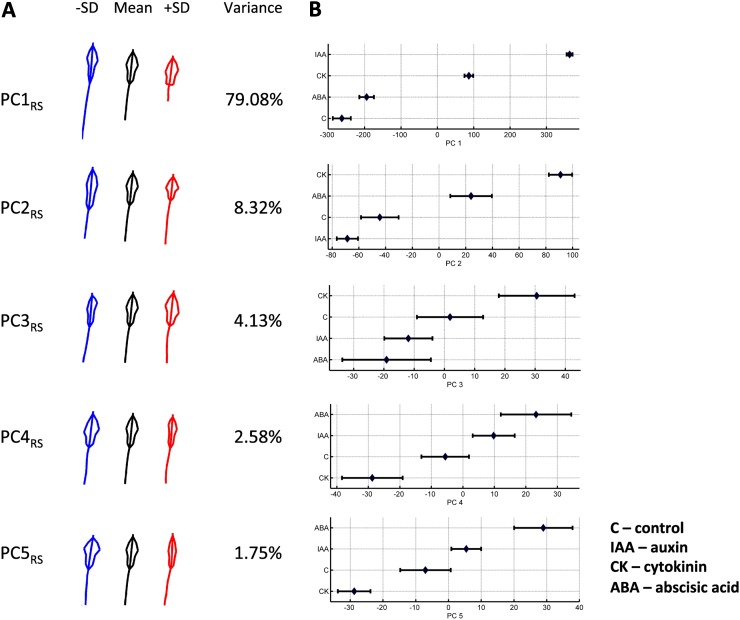
Figure 2.
Variability of the root system shape and size of Arabidopsis Col-0 quantified with RootScape, as described by the five main PCs from the allometric Col-0 model. A, For each PC, the mean root shape outline is shown in black (middle), blue (left), and red (right); shapes are shown by varying the PC value minus or plus 1 sd (−SD and +SD). The percentage of variance of each PC is shown next to the shapes. B, PC values for the first five PCs are plotted on the x axis against the four different conditions. The mean of each of the four treatments is represented by a diamond, and the error bars display the variation observed for each group.

